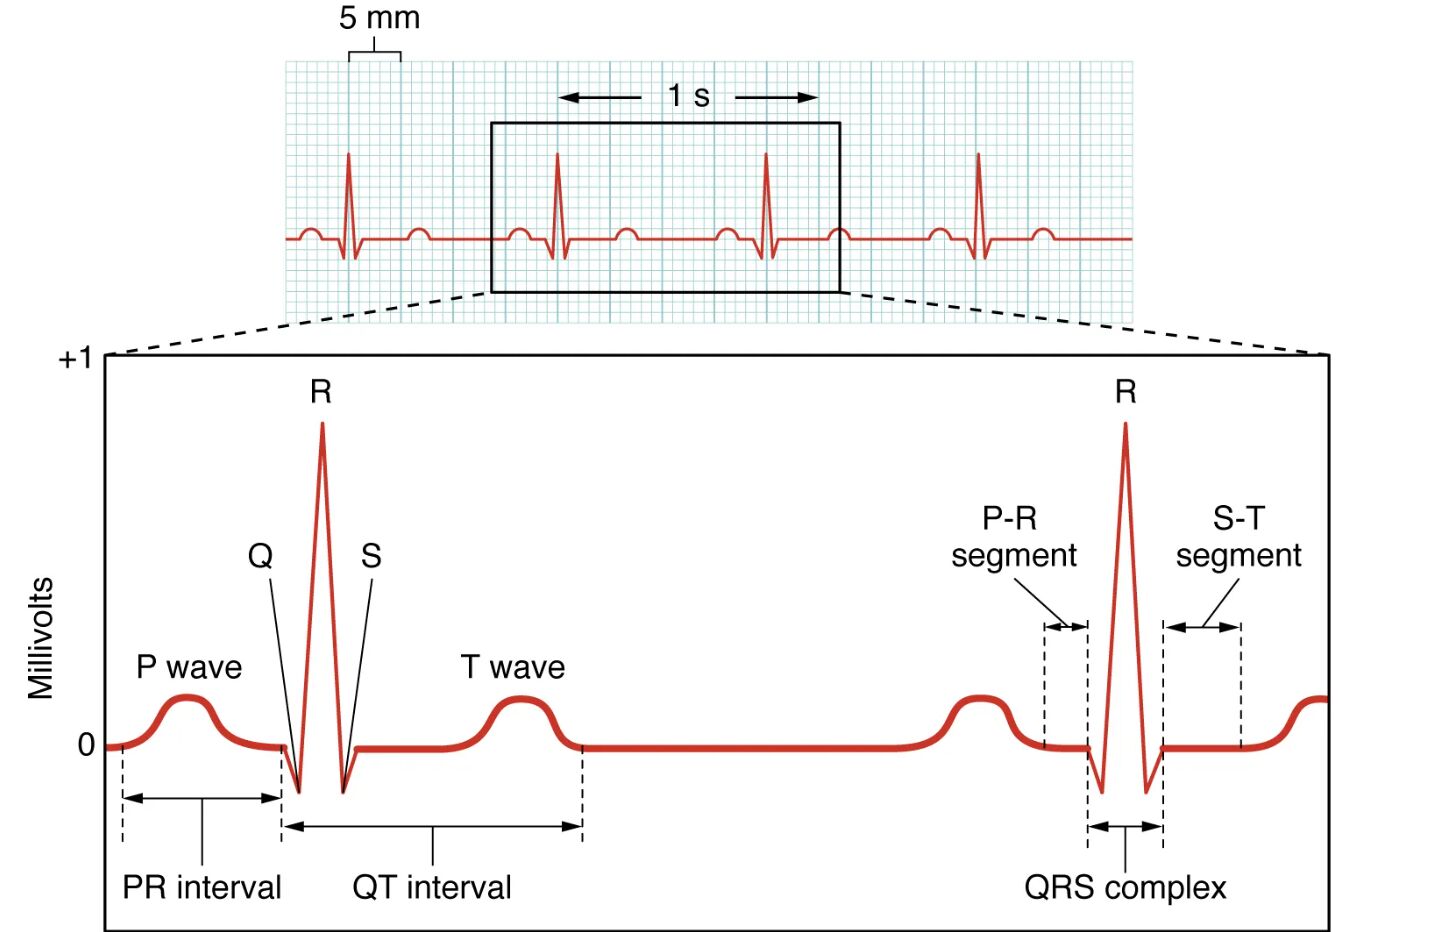
An electrocardiogram (EKG or ECG) is a powerful diagnostic tool that records the electrical activity of the heart, providing critical insights into its function. This diagram illustrates a normal EKG tracing, featuring the P wave, QRS complex, T wave, PR interval, QT interval, QRS interval, ST interval, P-R segment, and S-T segment, which together reflect the heart’s electrical and mechanical cycles. Exploring this image offers a comprehensive understanding of how these components are used to assess cardiac health.
Labelled Parts Explanation
- P wave The P wave represents atrial depolarization, the electrical activation of the atria that precedes their contraction. It is typically a small, smooth upward deflection on the EKG, indicating the start of the cardiac cycle.
- QRS complex The QRS complex reflects ventricular depolarization, the electrical activation that triggers ventricular contraction, consisting of the Q, R, and S waves. Its duration and morphology provide insights into ventricular conduction and potential abnormalities.
- T wave The T wave signifies ventricular repolarization, the recovery phase of the ventricles after contraction, appearing as a broader, positive wave following the QRS complex. It indicates the return to the resting state and is essential for assessing repolarization patterns.
- PR interval The PR interval measures the time from the start of the P wave to the beginning of the QRS complex, representing atrial depolarization and the delay at the atrioventricular node. It typically lasts 120-200 ms and helps evaluate atrioventricular conduction.
- QT interval The QT interval spans from the start of the QRS complex to the end of the T wave, encompassing ventricular depolarization and repolarization. Its duration, adjusted for heart rate, is critical for detecting conditions like long QT syndrome.
- QRS interval The QRS interval, or QRS duration, measures the time taken for ventricular depolarization, from the Q wave’s onset to the S wave’s end, typically lasting 60-100 ms. It assesses the speed and synchrony of ventricular activation.
- ST interval The ST interval extends from the end of the S wave to the beginning of the T wave, representing the early phase of ventricular repolarization. It is a key marker for ischemia or infarction when elevated or depressed.
- P-R segment The P-R segment is the flat portion between the end of the P wave and the start of the QRS complex, reflecting the time when the impulse travels through the atrioventricular node. It is normally isoelectric and helps detect atrial abnormalities.
- S-T segment The S-T segment is the portion from the end of the S wave to the start of the T wave, indicating the period of ventricular recovery before repolarization. Changes in its elevation or depression are significant for diagnosing myocardial injury.
Anatomical Overview of the EKG Tracing
The EKG tracing is a visual representation of the heart’s electrical activity, captured through standardized lead placements. This diagram breaks down the normal waveform into identifiable components that reflect the cardiac cycle.
- The P wave marks the onset of atrial activity, initiating the heartbeat.
- The QRS complex and T wave represent the ventricular phase, from contraction to recovery.
- The PR interval, QT interval, QRS interval, ST interval, P-R segment, and S-T segment provide timing and interval data.
- These elements together offer a complete picture of cardiac electrical function.
This overview is essential for interpreting heart health.
Role of the P Wave and QRS Complex
The P wave and QRS complex are the foundational waves of the EKG. They indicate the start and peak of cardiac activity.
- The P wave shows atrial depolarization, typically lasting 80-100 ms.
- The QRS complex represents ventricular depolarization, with the R wave being the most prominent.
- Abnormal P wave duration may suggest atrial enlargement.
- A widened QRS complex can indicate bundle branch block.
These waves are critical for rhythm assessment.
Significance of the T Wave and Intervals
The T wave and various intervals provide insight into ventricular recovery and conduction. Their analysis supports diagnosis.
- The T wave reflects ventricular repolarization, varying in shape based on lead placement.
- The PR interval assesses atrioventricular node function, with prolongation indicating delay.
- The QT interval monitors repolarization duration, with abnormalities linked to arrhythmias.
- The QRS interval evaluates ventricular conduction speed.
These components are vital for detecting cardiac issues.
Function of ST and Segment Measurements
The ST interval and segments offer detailed views of ventricular recovery. Their changes signal potential problems.
- The ST interval indicates early repolarization, with elevation suggesting acute injury.
- The S-T segment depression may point to ischemia or subendocardial infarction.
- The P-R segment helps identify atrial infarction or pericarditis.
- These measurements guide acute coronary syndrome management.
Accurate segment analysis is key to timely intervention.
Physiological Importance of EKG Components
The EKG components collectively reflect the heart’s electrical and mechanical harmony. Their timing ensures efficient pumping.
- The P wave and QRS complex initiate atrial and ventricular contractions.
- The T wave and ST interval ensure proper repolarization and recovery.
- The PR interval and QT interval maintain synchronized timing.
- This coordination supports steady blood flow.
The EKG’s design mirrors cardiac physiology.
Clinical Relevance of EKG Tracing
Understanding the EKG tracing aids in diagnosing a range of cardiac conditions. These features are essential clinical tools.
- An inverted T wave can indicate myocardial ischemia or electrolyte imbalance.
- A prolonged QT interval is associated with long QT syndrome, risking torsades de pointes.
- The ST interval elevation is a hallmark of acute myocardial infarction.
- Regular monitoring of these components guides treatment plans.
This knowledge enhances cardiac care effectiveness.
Conclusion
The electrocardiogram EKG diagram provides a detailed guide to the normal tracing of the heart’s electrical activity, featuring the P wave, QRS complex, T wave, PR interval, QT interval, QRS interval, ST interval, P-R segment, and S-T segment. By exploring how these components reflect the cardiac cycle, from atrial depolarization to ventricular repolarization, one gains insight into the heart’s functional integrity. This understanding serves as a foundation for studying cardiac diagnostics and addressing related health concerns, encouraging further exploration of the EKG’s role in maintaining cardiovascular health.

