Vascular imaging serves as a critical diagnostic bridge in modern medicine, allowing clinicians to observe the rhythmic flow of life without invasive procedures. The carotid artery system is of paramount importance because it provides the primary blood supply to the brain, and any disruption in its function can lead to catastrophic neurological events. Doppler ultrasound stands at the forefront of this evaluation, utilizing the shift in sound wave frequencies to calculate real-time blood flow velocities and resistance. Specifically, examining the proximal segment of the common carotid artery allows for an assessment of the foundational pressure and flow characteristics as blood leaves the heart and enters the cervical vasculature. By integrating visual color flow mapping with quantitative spectral waveforms, physicians can build a comprehensive profile of a patient’s cardiovascular health, identifying the early markers of systemic disease and stroke risk long before clinical symptoms emerge.
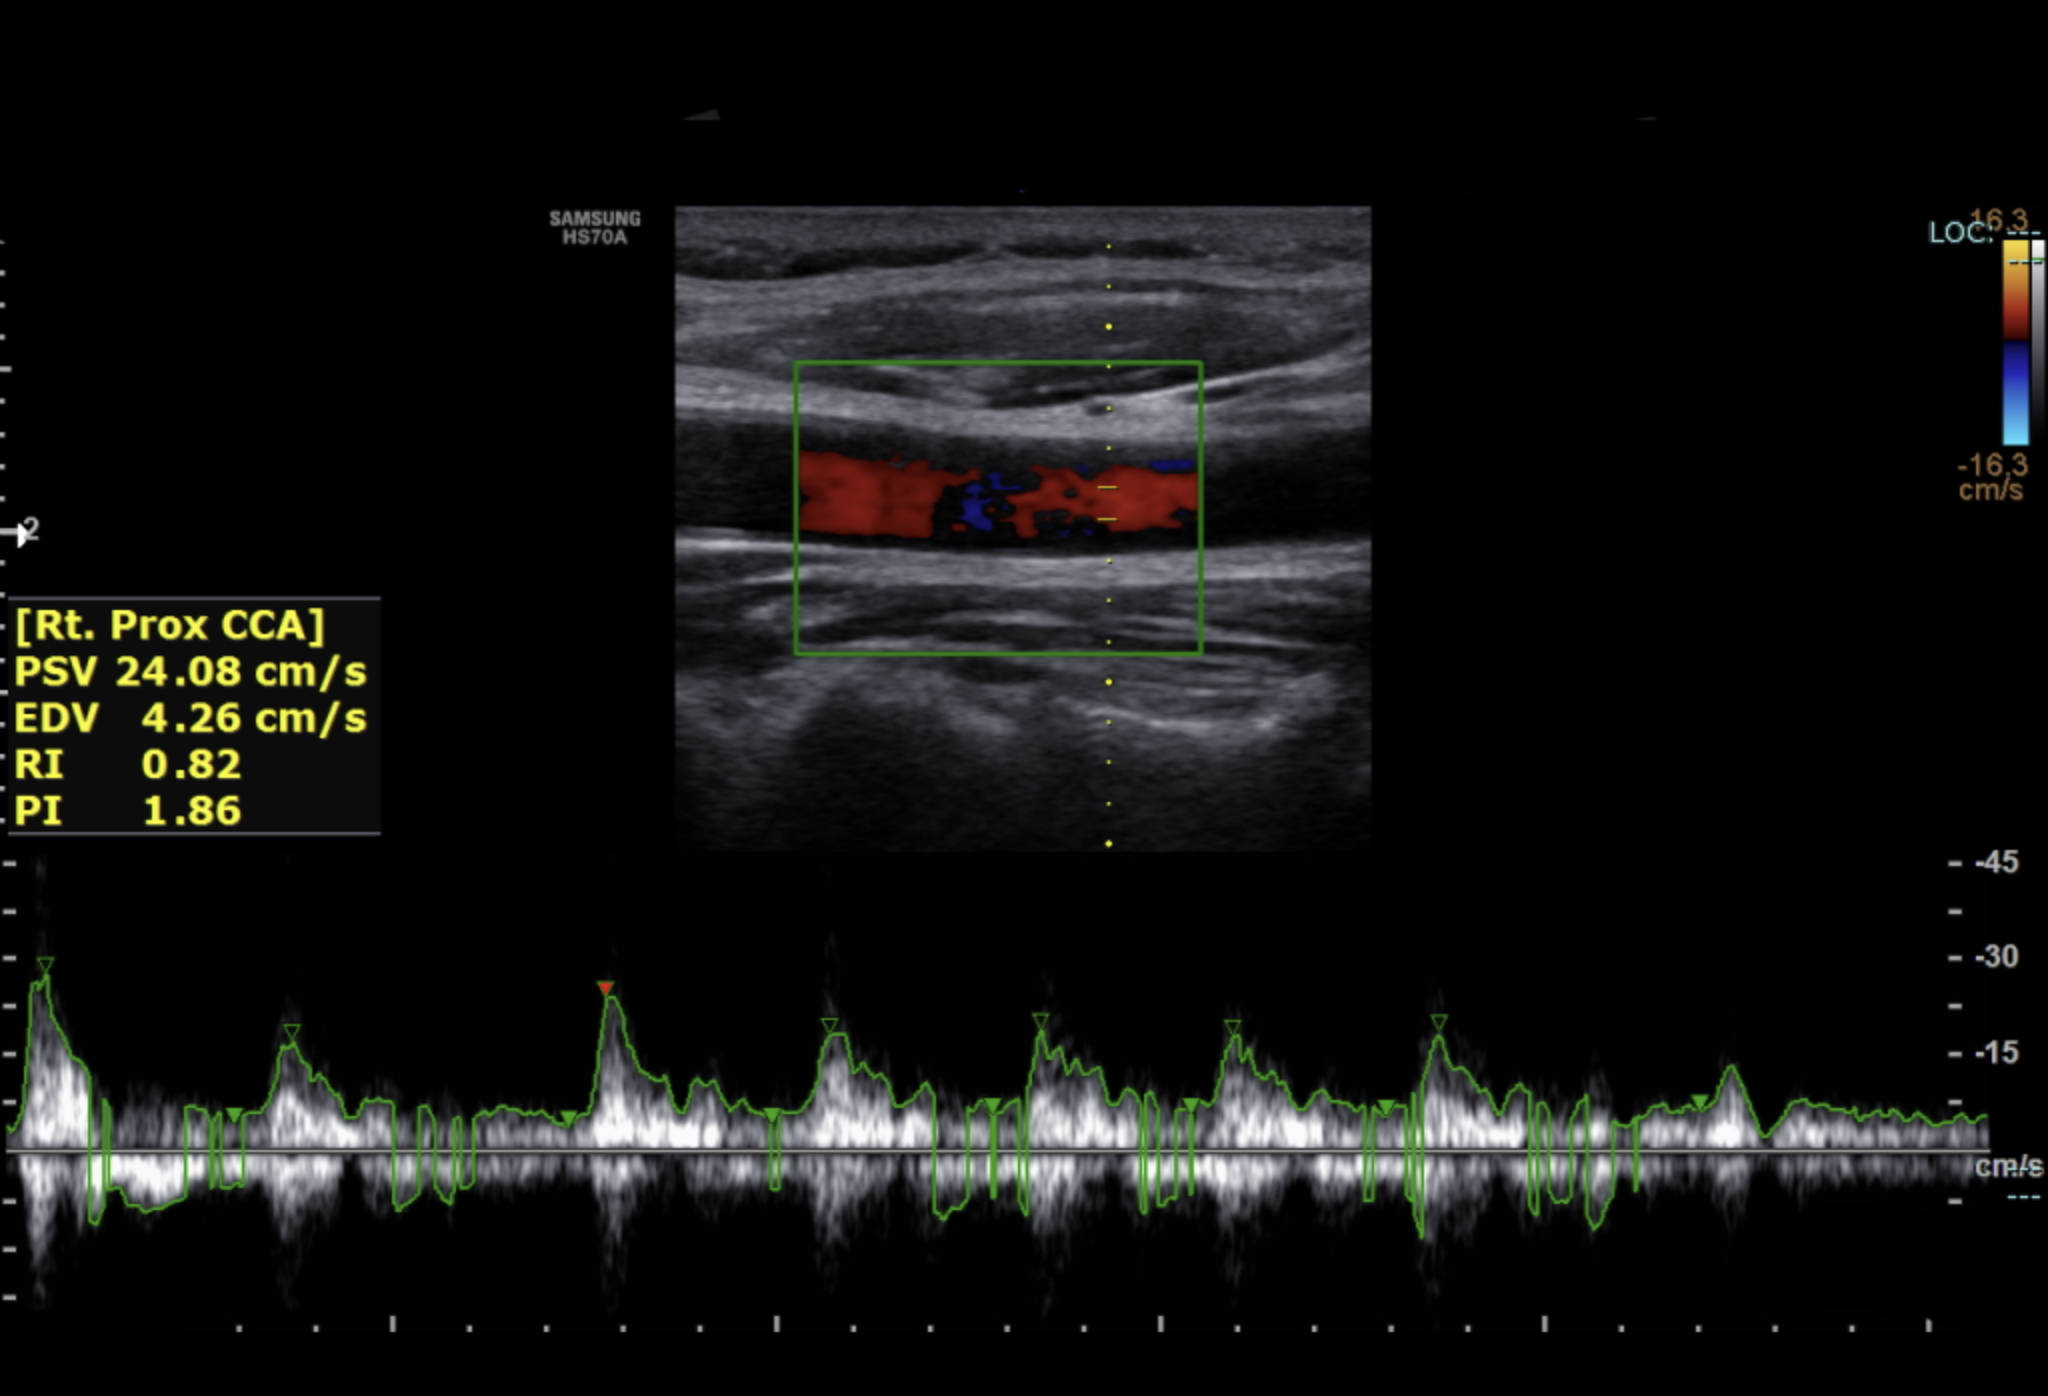
[Rt. Prox CCA]: This label stands for the Right Proximal Common Carotid Artery, indicating the specific anatomical site and side being examined. The proximal designation means the measurement is taken near the vessel’s origin, which on the right side is typically the brachiocephalic trunk.
PSV 24.08 cm/s: The Peak Systolic Velocity represents the maximum speed of blood flow recorded during the contraction of the heart’s left ventricle. In this image, a value of 24.08 cm/s is noted, which is a critical metric used to assess for potential narrowing or obstructions within the vessel lumen.
EDV 4.26 cm/s: End Diastolic Velocity is the measurement of blood flow speed just before the next heartbeat begins. This value reflects the baseline flow maintained during the heart’s relaxation phase and is highly sensitive to changes in peripheral resistance within the brain’s circulatory network.
RI 0.82: The Resistive Index is a calculated ratio derived from the systolic and diastolic velocities to quantify the resistance to flow in the distal vascular bed. An RI of 0.82 provides a numerical snapshot of the vascular tone, helping clinicians differentiate between high-resistance and low-resistance flow patterns.
PI 1.86: The Pulsatility Index measures the degree of variability in blood flow velocity throughout the entire cardiac cycle. This index is particularly useful for identifying abnormalities in the arterial wall elasticity or downstream obstructions that might not be captured by velocity measurements alone.
Color Doppler Box: The green rectangular area overlaying the B-mode image displays real-time flow direction and velocity using a color scale. Red typically signifies flow toward the ultrasound probe, while blue indicates flow away, allowing for the rapid detection of turbulence or flow reversal.
Spectral Waveform: The graph at the bottom of the screen plots velocity over time, showing a sharp systolic peak followed by a gradual diastolic decline. The characteristic “triphasic” or “biphasic” shape of this wave is essential for diagnosing the overall health of the arterial system.
Velocity Scale: Located on the right side of the spectral waveform, this vertical axis provides the numerical reference for measuring blood speed in cm/s. It ensures that the visual representation of the waves is accurately calibrated for quantitative diagnostic analysis.
The Physics and Function of Carotid Doppler Imaging
The core of carotid imaging lies in the Doppler effect, a principle of physics where the frequency of a sound wave changes relative to the motion of the source or observer. In this medical application, the ultrasound probe emits high-frequency sound waves that bounce off moving red blood cells. By measuring the change in frequency of the returning echoes, the machine can calculate the exact speed of the blood. This allows for the non-invasive visualization of **hemodynamic parameters** that were once only accessible through dangerous catheterizations. The combination of B-mode imaging (which shows anatomy) and Doppler imaging (which shows flow) is often referred to as “Duplex” ultrasonography.
As seen in the provided image, the “Color Doppler” provides a qualitative overview, while the “Spectral Doppler” provides the raw data. This dual-layered approach is essential because blood flow is not uniform throughout the vessel; it tends to be faster in the center (laminar flow) and slower near the walls. By placing the “sample volume” or “gate” in the center of the vessel, as indicated by the dotted yellow line, the sonographer ensures they are measuring the most representative velocities, providing a consistent baseline for comparison during future patient visits.
Clinical Significance of PSV and EDV Measurements
The Peak Systolic Velocity (PSV) is the most widely used measurement in the screening for **carotid stenosis**, which is the narrowing of the artery usually caused by plaque buildup. When an artery narrows, the blood must travel faster to pass through the constricted area, similar to water flowing through a squeezed garden hose. Therefore, a significantly elevated PSV is a hallmark sign of a blockage. Conversely, if the PSV is abnormally low, it may indicate a problem with the heart’s pumping ability or a blockage further “upstream” (closer to the heart) that is damping the flow before it reaches the neck.
The End Diastolic Velocity (EDV) is equally important, particularly in assessing the blood supply to the brain. Because the brain is a high-demand organ with low resistance, we expect to see a healthy amount of flow even when the heart is resting (diastole). A low EDV or a “reversed” flow during diastole can indicate high intracranial pressure or severe distal blockages. In the image shown, the EDV of 4.26 cm/s combined with a PSV of 24.08 cm/s provides a resistive index of 0.82. While the velocities here are on the lower end of the typical physiological range, the overall waveform morphology remains sharp and organized, which is a positive indicator of vascular integrity.
Atherosclerosis and Arterial Wall Indices
Beyond simple velocities, indices like the RI and PI offer deep insights into the structural health of the vessel. **Atherosclerosis** is a chronic inflammatory process that not only narrows the vessel but also makes the arterial walls rigid. A stiff, calcified artery will have a higher Pulsatility Index (PI) because it lacks the elastic “recoil” to smooth out the heart’s pulses. Similarly, the Resistive Index (RI) helps determine if the organs being supplied are resisting the blood flow. A high RI in the carotid artery can be an early warning sign of small-vessel disease within the brain, often seen in patients with long-standing, uncontrolled hypertension or diabetes.
Screening the proximal common carotid artery is often the first step in a comprehensive vascular check-up. Because this segment is relatively straight and easy to access, it serves as a reliable control point. If abnormalities are found here, the sonographer will proceed to scan the carotid bulb and the internal carotid artery (ICA), where plaques are more likely to form due to the turbulent flow at the vessel bifurcation. This systematic approach ensures that no subtle indicators of vascular aging are missed, providing a proactive pathway for stroke prevention through lifestyle changes or medication.
Indications and the Future of Vascular Screening
Carotid Doppler is typically indicated for patients who have suffered a transient ischemic attack (TIA) or a stroke, as well as those with a “bruit” (a whooshing sound) heard through a stethoscope during a physical exam. However, it is increasingly being used as a screening tool for asymptomatic patients with multiple risk factors, such as high cholesterol, smoking history, or a family history of heart disease. The ability to quantify the PI and RI allows for a more nuanced understanding of a patient’s cardiovascular risk than traditional blood pressure cuffs alone.
Looking forward, the integration of artificial intelligence with ultrasound technology is set to revolutionize these measurements. AI algorithms can now assist sonographers by automatically identifying the vessel walls and calculating the PSV and EDV with even higher precision, reducing the variability between different technicians. Despite these high-tech advancements, the fundamental goal remains the same: to protect the delicate tissues of the brain by ensuring a steady, unimpeded supply of oxygenated blood. As our understanding of hemodynamics continues to grow, tools like the Doppler ultrasound of the right proximal common carotid artery will remain indispensable in the fight against vascular disease.
Conclusion
The Doppler ultrasound of the right proximal common carotid artery is far more than a simple image; it is a sophisticated data set that tells the story of a patient’s circulatory health. Through the careful measurement of systolic and diastolic velocities and the calculation of resistive indices, clinicians are able to peer through the skin and detect the earliest whispers of arterial disease. Whether used to monitor the progression of atherosclerosis or to screen for life-threatening stenosis, this technology provides the quantitative evidence needed for effective medical decision-making. By maintaining a sharp focus on the hemodynamic stability of the carotid system, we can continue to advance the goals of preventive medicine and significantly reduce the global burden of stroke and heart disease.

