An electrocardiogram (ECG) tracing provides a window into the heart’s electrical activity, intricately linked to its mechanical contractions during the cardiac cycle. This diagram correlates the P wave, QRS complex, T wave, PR interval, QT interval, QRS interval, ST interval, P-R segment, S-T segment, atrial systole, ventricular systole, and ventricular diastole with their respective electrical and mechanical events, offering a detailed view of heart function. Exploring this image enhances understanding of how electrical signals translate into the heart’s pumping action.
Labelled Parts Explanation
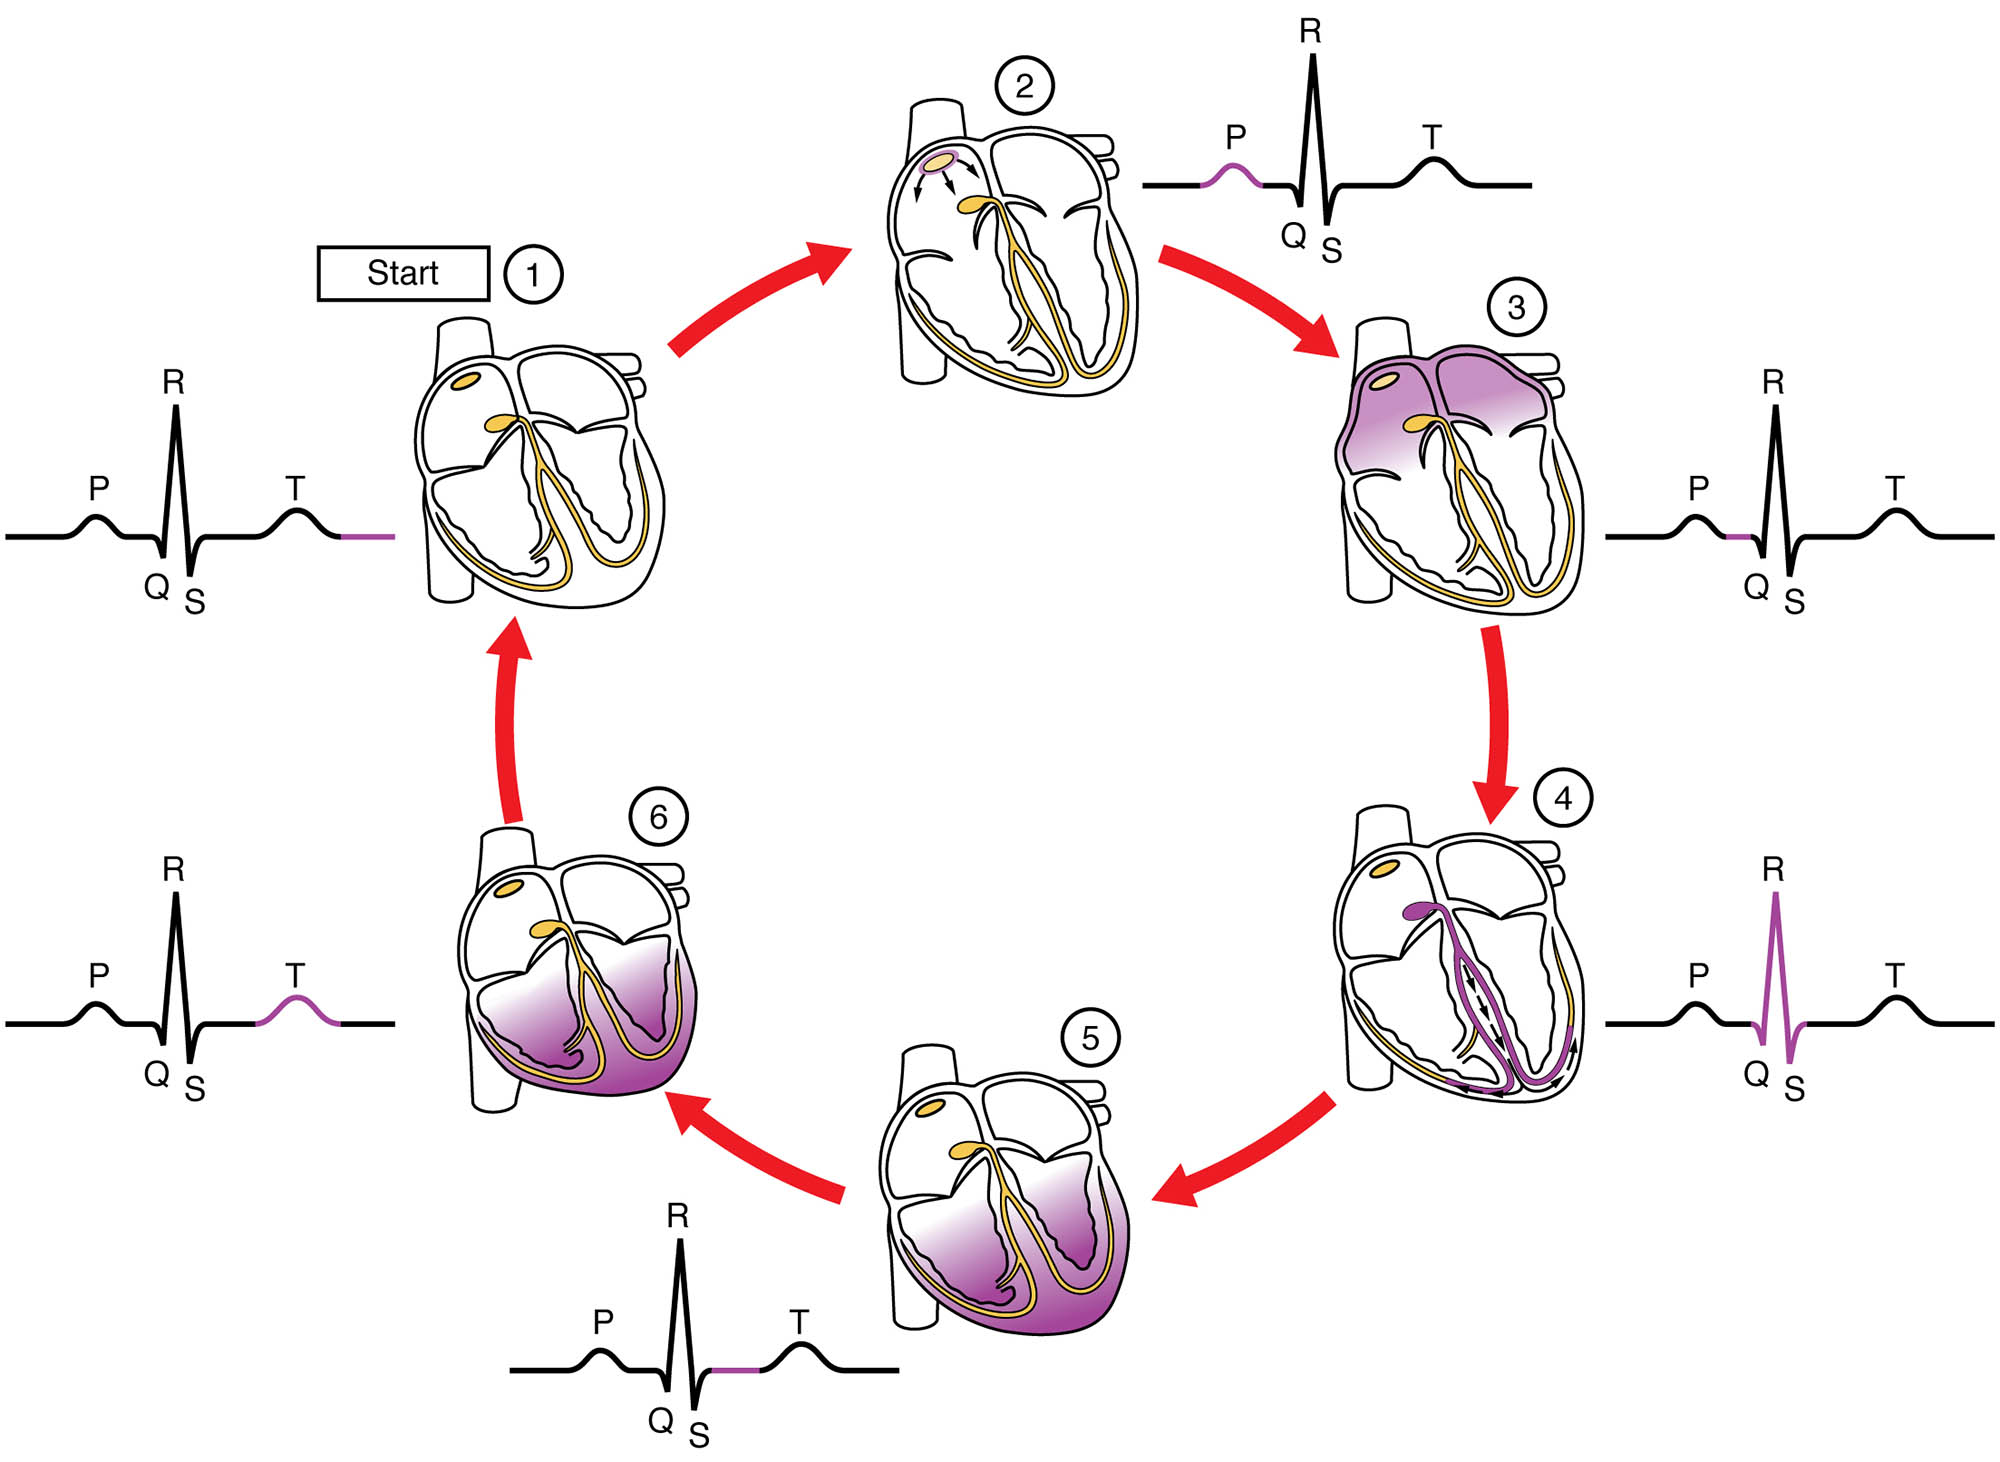
- P wave The P wave represents atrial depolarization, the electrical activation that initiates atrial contraction or systole. It corresponds to the mechanical event of atrial systole, pushing blood into the ventricles.
- QRS complex The QRS complex indicates ventricular depolarization, triggering ventricular contraction or systole, and includes the Q, R, and S waves. It aligns with the start of ventricular systole, where blood is ejected into the pulmonary artery and aorta.
- T wave The T wave signifies ventricular repolarization, the recovery phase following contraction, appearing as a positive deflection. It correlates with the early phase of ventricular diastole, allowing the ventricles to relax and refill.
- PR interval The PR interval measures the time from the P wave’s onset to the QRS complex’s start, reflecting atrial depolarization and AV node delay. It corresponds to the period leading into atrial systole and the initial ventricular preparation.
- QT interval The QT interval spans from the QRS complex’s start to the T wave’s end, encompassing ventricular depolarization and repolarization. It aligns with the ventricular systole and early ventricular diastole phases.
- QRS interval The QRS interval, or QRS duration, tracks the time of ventricular depolarization from Q to S, typically 60-100 ms. It directly correlates with the onset and peak of ventricular systole.
- ST interval The ST interval extends from the S wave’s end to the T wave’s start, representing early ventricular repolarization. It corresponds to the transition from ventricular systole to the beginning of ventricular diastole.
- P-R segment The P-R segment is the flat line between the P wave and QRS complex, indicating the AV node delay. It aligns with the late phase of atrial contraction and preparation for ventricular systole.
- S-T segment The S-T segment runs from the S wave’s end to the T wave’s start, marking the early repolarization phase. It correlates with the end of ventricular systole and the onset of ventricular diastole.
- Atrial systole The atrial systole is the mechanical contraction of the atria, pushing the final volume of blood into the ventricles. It occurs during the P wave and PR interval on the ECG.
- Ventricular systole The ventricular systole is the contraction phase of the ventricles, ejecting blood into the pulmonary artery and aorta. It is represented by the QRS complex and part of the ST interval.
- Ventricular diastole The ventricular diastole is the relaxation and filling phase of the ventricles, allowing blood from the atria. It corresponds to the T wave and the later ST interval and P-R segment of the next cycle.
Anatomical Overview of ECG and Cardiac Cycle Correlation
The ECG tracing serves as a real-time map of the heart’s electrical and mechanical events during the cardiac cycle. This diagram links each waveform and interval to the corresponding phase of heart activity.
- The P wave and atrial systole mark the start of the cycle with atrial contraction.
- The QRS complex and ventricular systole drive the ejection of blood.
- The T wave and ventricular diastole facilitate relaxation and refilling.
- Intervals like the PR interval, QT interval, QRS interval, ST interval, P-R segment, and S-T segment provide timing details for these events.
This correlation is key to interpreting cardiac function.
Role of P Wave and Atrial Systole
The P wave and atrial systole initiate the cardiac cycle. Their coordination ensures proper blood flow.
- The P wave reflects electrical activation of the atria, lasting 80-100 ms.
- The atrial systole pushes 20-30% of ventricular filling volume.
- The PR interval includes this phase, showing AV node delay.
- This step prepares the ventricles for contraction.
These events are critical for efficient preload.
Significance of QRS Complex and Ventricular Systole
The QRS complex and ventricular systole represent the heart’s pumping phase. Their alignment drives circulation.
- The QRS complex indicates ventricular depolarization, typically 60-100 ms.
- The ventricular systole ejects blood into the pulmonary and systemic circuits.
- The QRS interval measures this depolarization duration.
- This phase generates the heart’s primary output.
These components are vital for cardiac output.
Function of T Wave and Ventricular Diastole
The T wave and ventricular diastole mark the recovery and filling phases. Their role supports the next cycle.
- The T wave shows ventricular repolarization, varying by lead.
- The ventricular diastole allows passive and active filling from the atria.
- The ST interval and S-T segment align with early diastole.
- This phase ensures adequate preload for the next beat.
These events maintain continuous circulation.
Physiological Importance of ECG Intervals and Segments
The intervals and segments on the ECG correlate with mechanical events. Their timing optimizes heart function.
- The PR interval ensures atrial contraction precedes ventricular action.
- The QT interval encompasses the entire ventricular electrical cycle.
- The ST interval and S-T segment reflect repolarization stability.
- The P-R segment indicates the AV node’s role in timing.
This synchronization supports efficient pumping.
Clinical Relevance of ECG-Cardiac Cycle Correlation
Understanding the ECG’s correlation with the cardiac cycle aids in diagnosing heart conditions. These features are key clinical markers.
- A prolonged PR interval may indicate first-degree AV block.
- An elevated ST interval suggests acute myocardial infarction.
- The QT interval prolongation is linked to long QT syndrome.
- The QRS complex widening can signal bundle branch block.
This knowledge guides effective cardiac interventions.
Conclusion
The ECG tracing correlated to the cardiac cycle diagram offers a detailed view of how electrical activity on the ECG corresponds to the heart’s mechanical events, including the P wave, QRS complex, T wave, PR interval, QT interval, QRS interval, ST interval, P-R segment, S-T segment, atrial systole, ventricular systole, and ventricular diastole. By exploring these relationships, one gains insight into the heart’s synchronized function, from atrial contraction to ventricular relaxation. This understanding serves as a foundation for studying cardiac physiology and addressing related health concerns, encouraging further exploration of the ECG’s role in monitoring and maintaining cardiovascular health.

