In the realm of cellular physiology, few visual aids are as striking or as educational as high-resolution micrographs of red blood cells reacting to their environment. These images transition the concept of osmosis from a theoretical chemical formula to a tangible, physical reality. Red blood cells, or erythrocytes, are exquisitely sensitive to the concentration of solutes in the fluid that bathes them. Because their membranes are flexible and lack rigid internal structures like a nucleus, they serve as perfect biological indicators of the fluid’s tonicity. Observation through a microscope reveals that even slight deviations in the salt or sugar concentrations of plasma can induce radical changes in cellular morphology, demonstrating the constant mechanical struggle for equilibrium that occurs within our circulatory system every second of our lives.
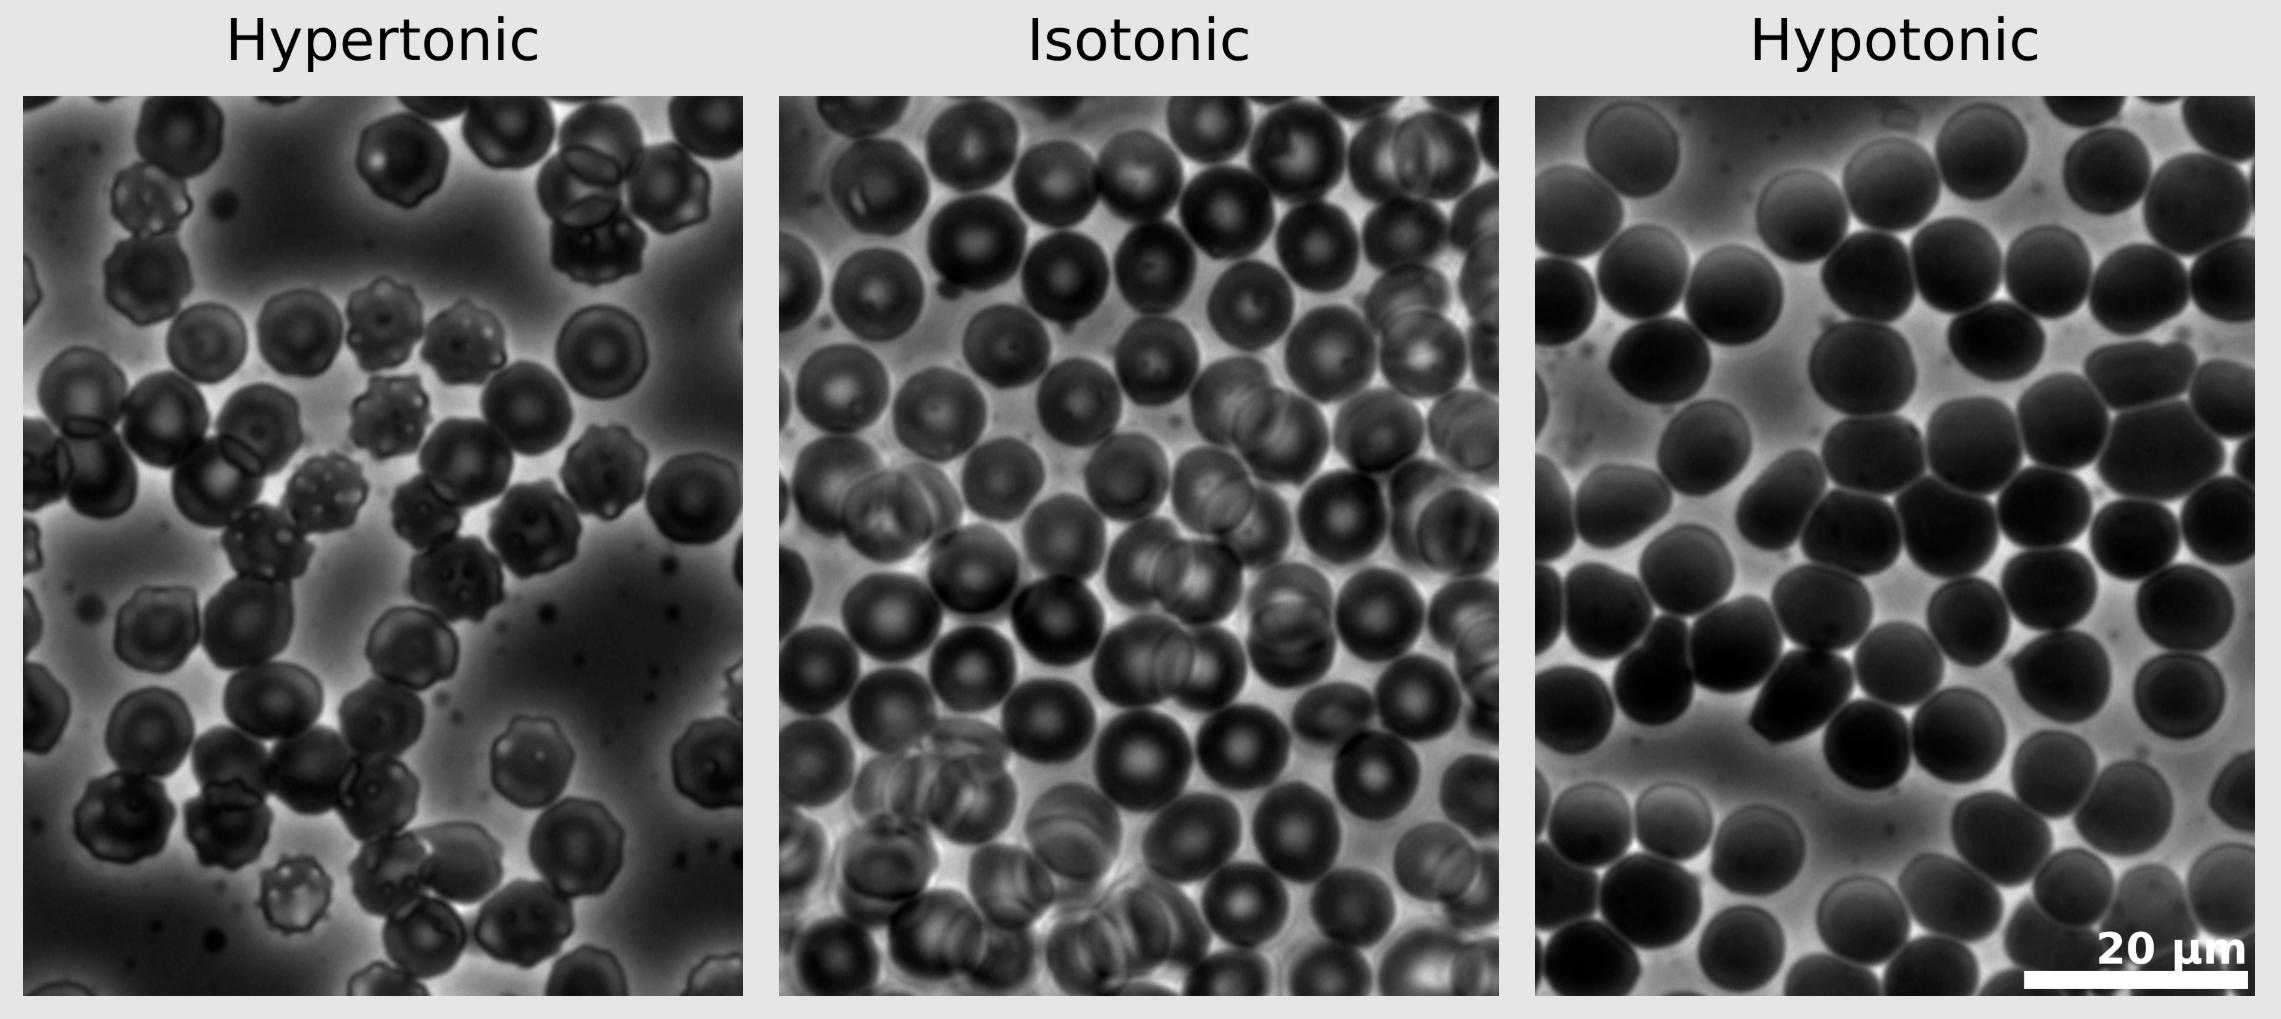
Hypertonic: This label indicates the leftmost micrograph, where the surrounding solution has a higher solute concentration than the interior of the cells. You can see the red blood cells appear shriveled and spiked, a physical state known as crenation caused by the rapid exit of water.
Isotonic: The central micrograph represents the physiological norm, where the external solute concentration perfectly matches the internal environment. The cells here maintain their healthy, smooth, biconcave disc shape, which is the optimal configuration for gas transport.
Hypotonic: The rightmost micrograph shows the effect of a low-solute environment, where water has rushed into the cells to equalize the pressure. The cells appear as large, darkened spheres, indicating they are stretched to their limit and are at risk of bursting.
20 µm: This scale bar provides a reference for the size of the objects being viewed, with 20 micrometers representing about two to three times the diameter of a normal red blood cell. It allows researchers to quantify exactly how much the cells have shrunk or expanded under different osmotic conditions.
The Physics of Microscopic Osmosis
The movement of water across the cell membrane is governed by the principles of diffusion, specifically the drive to move from an area of high water concentration (low solute) to low water concentration (high solute). This movement creates a measurable force known as osmotic pressure. In the provided micrographs, we see this force acting as a sculptor, reshaping the lipid bilayer based on the chemistry of the surrounding medium. The red blood cell membrane is highly permeable to water but restrictive to ions like sodium and potassium. Therefore, the water must move to compensate for any concentration gradient that the ions cannot cross.
This biological mechanism is vital because it prevents the buildup of dangerous pressure gradients within the body’s tissues. If cells were not able to adjust their volume, the mechanical stress on the membrane would be far greater. However, as the micrographs clearly show, this flexibility has its limits. The “normal” state seen in the middle panel is a delicate balance that the body works tirelessly to maintain through the complex coordination of the kidneys, the thirst mechanism, and various hormonal signals like antidiuretic hormone (ADH).
Visualizing Hypertonicity: The Crenated Cell
In the hypertonic micrograph, the erythrocytes have lost their smooth appearance and instead look like jagged, multi-pointed stars. This occurs because, as water leaves the cell, the internal volume decreases while the surface area of the membrane remains relatively constant. This forces the membrane to collapse and fold over the underlying cytoskeleton, creating the spikes seen in the image. This process, termed crenation, is often seen in clinical cases of extreme dehydration or when a patient is administered hypertonic saline for specific medical reasons, such as reducing intracranial pressure.
From a functional standpoint, a crenated cell is a compromised cell. Its jagged edges increase the likelihood of getting caught in the small meshwork of the spleen, leading to premature destruction. Furthermore, the increased viscosity of the cytoplasm inside a shrunken cell can hinder the efficient binding and release of oxygen by hemoglobin molecules. These micrographs serve as a stark reminder of why maintaining proper hydration is essential for ensuring that blood can flow smoothly through the body’s narrowest channels.
The Isotonic Ideal: Homeostasis in the Micrograph
The central panel of the micrograph depicts the “Goldilocks” zone of human biology. In an isotonic solution, the rate of water entering the cell is exactly equal to the rate of water leaving it. This state of equilibrium allows the red blood cell to maintain its iconic biconcave shape—a flat disc with a thin center and thicker edges. This shape is not accidental; it provides a high surface-area-to-volume ratio, which is critical for the rapid diffusion of oxygen and carbon dioxide. In an isotonic environment, the internal osmolarity of the cell is roughly 300 mOsm/L, a value the body defends vigorously.
When you look at this micrograph, you are seeing the cells as they should appear in a healthy human bloodstream. This is the goal of most basic intravenous fluid therapies; by using “normal saline” (0.9% NaCl), medical professionals ensure they are supporting the patient’s blood volume without causing the cellular distortions seen in the other two panels. This image highlights the stability that allows for the incredible longevity of red blood cells, which must survive approximately 120 days of constant mechanical stress within the circulatory system.
Hypotonicity and the Threshold of Hemolysis
The rightmost micrograph captures the cells in a state of extreme stress. In a hypotonic environment, water floods the cell in an attempt to dilute the internal solutes. The once-flat disc inflates into a sphere. While a sphere is a mathematically efficient way to hold volume, it is a mechanically dangerous shape for a red blood cell. Because the membrane cannot stretch infinitely, the spherical cell loses its elasticity. If the pressure continues to rise, the membrane will eventually reach its breaking point, resulting in hemolysis.
In the image, the cells appear darker and more crowded, reflecting their increased volume. If we were to view a video of this process, we would eventually see these spheres disappear as they rupture, leaving behind empty “ghost” membranes and releasing their hemoglobin into the surrounding fluid. This is why administering pure water intravenously is lethal; it triggers a wave of hemolysis that can lead to kidney failure, jaundice, and systemic shock. The micrograph provides the visual proof of why tonicity is a matter of life and death in clinical practice.
Conclusion
Micrographs of red blood cells subjected to varying osmotic pressures provide an invaluable window into the fundamental laws of biology. By observing the transition from the jagged, shrunken forms of hypertonicity to the bloated spheres of hypotonicity, we gain a profound appreciation for the isotonic balance that sustains us. These images are not just static pictures; they are representations of the dynamic forces that every cell in our body must navigate. Whether in the laboratory or at the patient’s bedside, understanding the visual cues of osmotic stress is essential for identifying disease, administering therapy, and appreciating the elegant simplicity of cellular homeostasis. The red blood cell remains our most visible and reliable narrator for the story of fluid balance in the human body.

