The Snellen chart is a fundamental tool used worldwide to assess visual acuity, offering a standardized method to measure how well a person can see at various distances. This image displays a classic Snellen chart, featuring rows of letters decreasing in size, each corresponding to a specific level of visual clarity, such as 20/20 or 20/200. By exploring its design and application, one can gain a deeper appreciation for how this simple yet effective chart helps in diagnosing vision conditions and monitoring eye health.
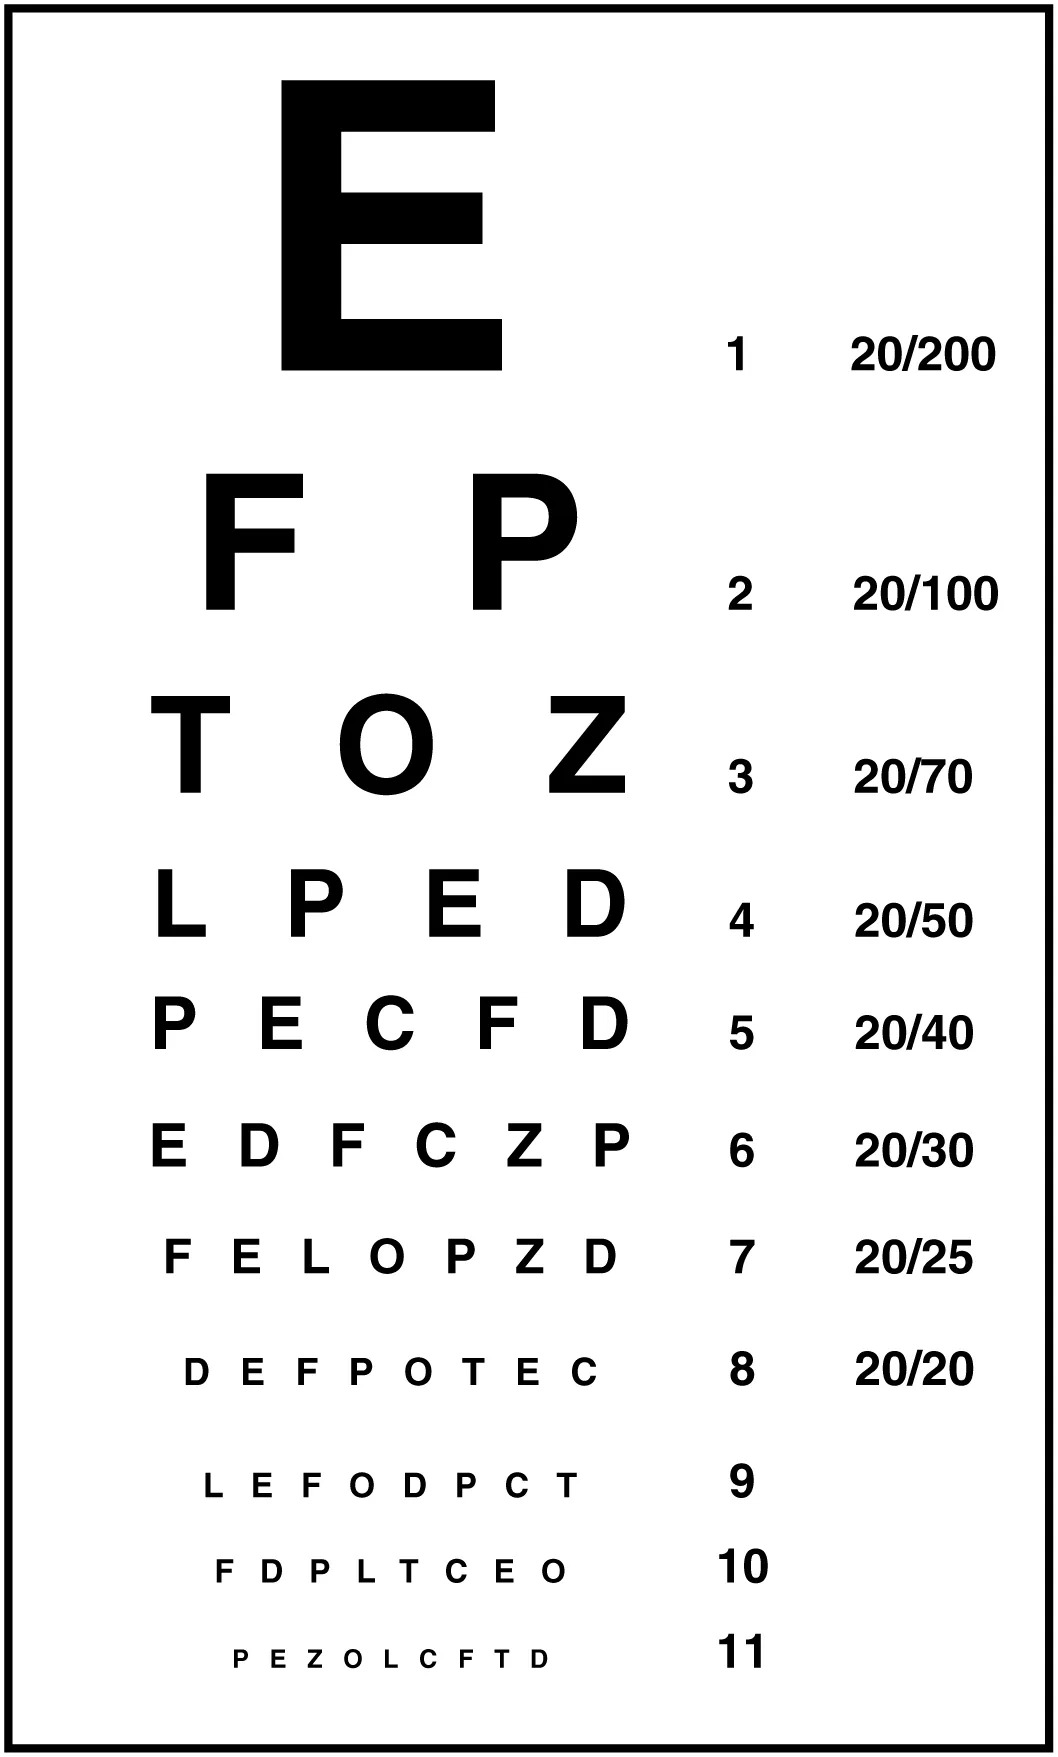
E The large “E” at the top of the chart serves as the initial test symbol, visible to individuals with significant visual impairment from a distance of 20 feet. It sets the baseline for assessing acuity, with the ability to identify it indicating at least 20/200 vision.
F P The “F P” row, the second line, tests vision at the 20/100 level, requiring the viewer to distinguish smaller letters than the top “E.” Successful reading of this line suggests better acuity, with normal vision capable of seeing it clearly at 100 feet.
T O Z The “T O Z” row corresponds to 20/70 vision, challenging the viewer to discern moderately sized letters. This line helps identify mild vision issues, as normal acuity can read it from 70 feet.
L P E D The “L P E D” row indicates 20/50 vision, assessing the ability to read slightly smaller letters. It serves as a midpoint in the chart, often used to detect early signs of visual decline.
P E C F D The “P E C F D” row represents 20/40 vision, a common threshold for driving standards in many regions. Reading this line suggests adequate acuity for most daily activities.
E D F C Z P The “E D F C Z P” row corresponds to 20/30 vision, indicating near-normal acuity with slightly smaller letters. It helps refine the assessment for those with minor visual challenges.
F E L O P Z D The “F E L O P Z D” row signifies 20/25 vision, approaching the standard for normal eyesight. This line tests the limits of fine detail perception.
D E F P O T E C The “D E F P O T E C” row marks 20/20 vision, the benchmark for normal acuity where letters are legible at 20 feet. It is the target for optimal visual function.
L E F O D P C T The “L E F O D P C T” row indicates 20/15 vision, exceeding normal acuity with even smaller letters. This level suggests exceptional clarity, often seen in younger individuals.
F D P L T C E O The “F D P L T C E O” row corresponds to 20/13 vision, testing super-normal acuity with tiny letters. It is rarely reached but indicates excellent visual health.
P E Z O L C F T D The “P E Z O L C F T D” row represents 20/10 vision, the finest level on this chart, requiring extraordinary detail recognition. Achieving this suggests near-perfect eyesight.
Design and Structure of the Snellen Chart
The Snellen chart’s layout is meticulously crafted for accuracy. Its descending letter sizes provide a reliable measure of visual capability.
- The Snellen chart uses Roman letters arranged in rows, each labeled with a vision fraction like 20/20.
- Letter sizes decrease progressively, with each row subtending 5 minutes of an arc at the designated distance.
- The top “E” is designed for 20/200 vision, the largest and most visible symbol.
- Numbers on the right indicate the visual acuity level, with 20/20 as the standard.
- The chart is typically viewed at 20 feet, though adjustments are made for smaller testing spaces.
How Visual Acuity is Measured
Visual acuity testing with the Snellen chart assesses the clarity of vision. This process helps identify potential eye issues early.
- The patient reads the smallest line possible with one eye covered, starting from the top.
- The 20/20 line represents normal vision, where the viewer sees at 20 feet what a standard eye sees at that distance.
- A 20/40 result means the viewer sees at 20 feet what a normal eye sees at 40 feet, indicating reduced acuity.
- Testing is conducted with corrected vision (glasses or contacts) and uncorrected to compare.
- Results guide referrals to specialists for conditions like myopia or hyperopia.
Factors Affecting Snellen Chart Results
Various elements influence performance on the Snellen chart. Understanding these helps interpret test outcomes accurately.
- Lighting conditions must be consistent, as dimness can obscure smaller letters.
- Distance from the chart, ideally 20 feet, ensures proper measurement unless adjusted.
- Age-related changes, like presbyopia, can lower acuity, especially after 40.
- Eye conditions such as cataracts or glaucoma can distort vision, affecting results.
- Thyroid hormones like T3 and T4 influence overall metabolic health, indirectly impacting eye function.
Clinical Applications of the Snellen Chart
The Snellen chart is a cornerstone in eye care settings. Its use extends beyond basic screening to broader health assessments.
- It is employed in routine eye exams to establish a baseline for visual health.
- Drivers’ license tests often require at least 20/40 vision, checked with this chart.
- Pediatric versions adapt the design for children, using symbols like animals.
- Occupational health screenings use it to ensure vision meets job requirements.
- Abnormal results prompt further tests, like retinal imaging or visual field analysis.
Interpreting Visual Acuity Scores
Understanding the numbers on the Snellen chart provides insight into vision quality. Each score reflects a specific capability.
- A 20/200 score indicates severe vision impairment, often legal blindness if uncorrectable.
- The 20/50 line suggests moderate difficulty, common with uncorrected refractive errors.
- Achieving 20/15 or 20/10 reflects above-average acuity, often in young or corrected eyes.
- Scores worse than 20/20 with correction may indicate underlying pathology.
- Regular monitoring tracks changes, guiding interventions like glasses or surgery.
Common Vision Conditions Detected
The Snellen chart helps identify issues needing attention. Its results can signal various ocular conditions.
- Myopia, or nearsightedness, shows as difficulty with distant lines like 20/40.
- Hyperopia, farsightedness, may affect near vision but is less obvious on the chart.
- Astigmatism causes blurred or distorted letters across multiple lines.
- Amblyopia, or lazy eye, results in unequal acuity between eyes.
- Early detection through the chart can prevent progression with timely treatment.
Maintaining Optimal Eye Health
Proactive care enhances performance on the Snellen chart. Simple habits support long-term vision.
- Regular eye exams using the chart ensure early detection of changes.
- A diet rich in vitamin A and omega-3s supports retinal health.
- Protecting eyes from UV light with sunglasses prevents damage.
- Adequate hydration maintains corneal clarity, aiding acuity.
- Limiting screen time reduces strain, preserving chart-reading ability.
In conclusion, the Snellen chart stands as a vital instrument in assessing visual acuity, offering a clear and standardized approach to evaluating eye health. From its structured design with decreasing letter sizes to its practical application in clinical settings, it provides essential data for diagnosing and managing vision conditions. By understanding its use and implications, individuals can take proactive steps to maintain optimal eyesight, ensuring clarity and quality of life through regular monitoring and care.

