The cardiac cycle represents the sequence of events that occur in the heart during one complete heartbeat, encompassing both mechanical and electrical activities. This intricate process ensures efficient blood circulation throughout the body, involving coordinated contractions and relaxations of the atria and ventricles. By examining the relationship between the cardiac cycle and the electrocardiogram (ECG), we gain valuable insights into heart function, which is essential for diagnosing and understanding cardiovascular health. The ECG waveform visually captures the electrical impulses that trigger these mechanical events, providing a non-invasive window into cardiac physiology.
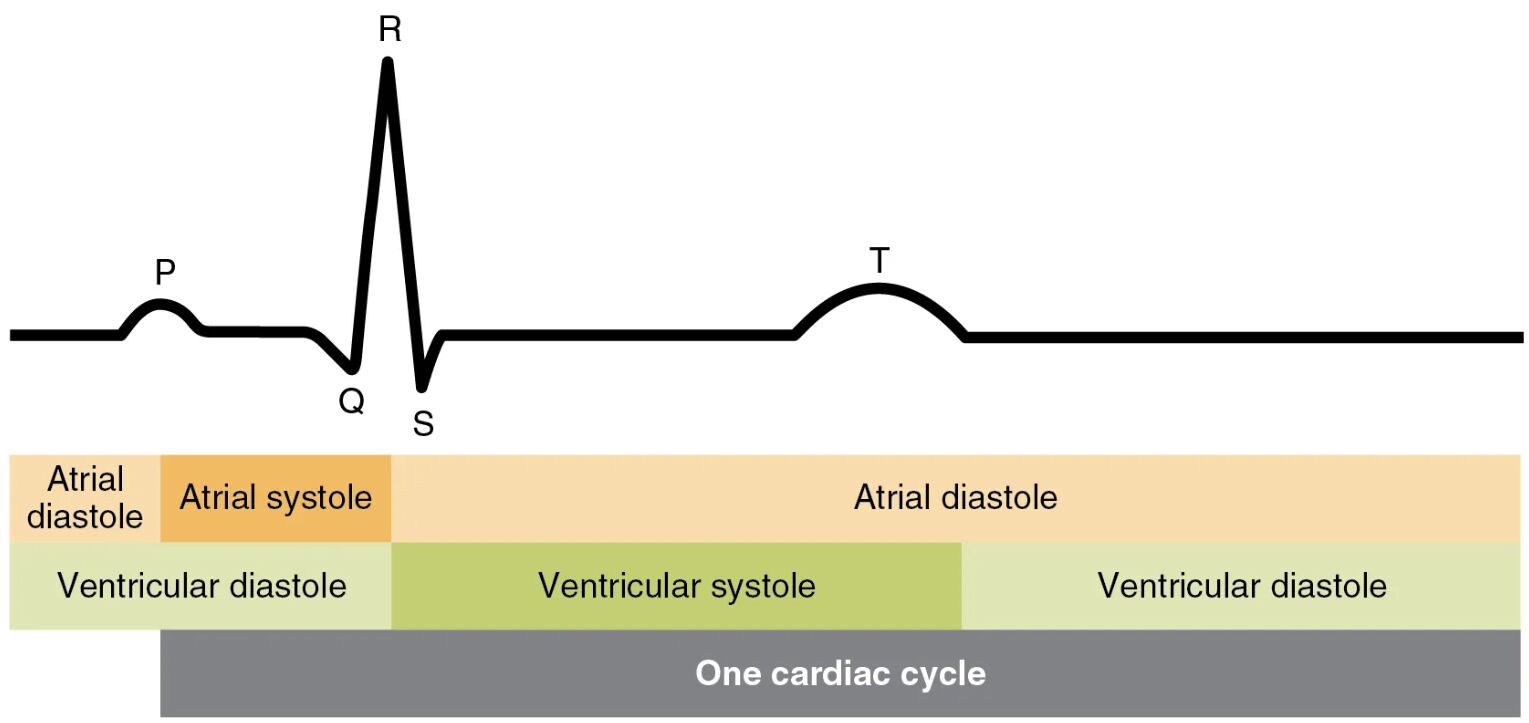
P The P wave on the ECG signifies the depolarization of the atria, marking the initiation of atrial contraction. This electrical activity spreads from the sinoatrial node, causing the atria to contract and push blood into the ventricles. It typically precedes the QRS complex and is crucial for assessing atrial function in clinical settings.
Q The Q wave is the initial negative deflection in the QRS complex, representing the early phase of ventricular depolarization. It occurs as the electrical impulse travels through the septum, and its presence or absence can indicate various cardiac conditions. In a normal ECG, the Q wave is small and helps in evaluating the overall ventricular activation pattern.
R The R wave is the prominent positive peak in the QRS complex, indicating the main phase of ventricular depolarization. This wave corresponds to the rapid spread of electrical activity through the ventricular myocardium, leading to strong contraction. Its amplitude and shape are key parameters in ECG interpretation for detecting abnormalities like hypertrophy.
S The S wave follows the R wave as a negative deflection, completing the QRS complex and signifying the final stages of ventricular depolarization. It reflects the activation of the basal portions of the ventricles. Clinicians often analyze the S wave in conjunction with other components to assess for issues such as bundle branch blocks.
T The T wave represents ventricular repolarization, where the ventricular muscle cells reset their electrical state after contraction. This phase is vital for preparing the heart for the next cycle and occurs during ventricular relaxation. Abnormalities in the T wave can signal electrolyte imbalances or ischemia.
Atrial Diastole Atrial diastole is the relaxation phase of the atria, allowing them to fill with blood from the veins. This period follows atrial systole and prepares the atria for the next contraction. It occupies a significant portion of the cardiac cycle, ensuring adequate blood volume for efficient pumping.
Atrial Systole Atrial systole involves the contraction of the atria, propelling additional blood into the ventricles. This “atrial kick” contributes about 20-30% of ventricular filling in a healthy heart. It directly follows the P wave and ends around the QRS complex, highlighting the synchronization between electrical and mechanical events.
Ventricular Diastole Ventricular diastole is the relaxation of the ventricles, during which they fill with blood from the atria. This phase includes early rapid filling and later atrial contribution, essential for maintaining cardiac output. It begins after the T wave and extends until the next QRS, allowing myocardial recovery.
Ventricular Systole Ventricular systole marks the contraction of the ventricles, ejecting blood into the arteries. This powerful phase follows the QRS complex and is responsible for systemic and pulmonary circulation. It ensures oxygenated blood reaches tissues, with its efficiency influenced by preload and afterload factors.
One Cardiac Cycle One cardiac cycle encompasses all events from the start of one heartbeat to the next, typically lasting about 0.8 seconds at rest. It integrates atrial and ventricular systole and diastole, synchronized by the heart’s electrical conduction system. Understanding this cycle is fundamental for comprehending heart rate variations and overall cardiovascular dynamics.
The Fundamentals of the Cardiac Cycle
The cardiac cycle is a rhythmic process that powers the heart’s pumping action, ensuring continuous blood flow. It is divided into distinct phases that align closely with electrical signals recorded on an ECG.
- The cycle begins with atrial depolarization, triggered by the sinoatrial (SA) node, often called the heart’s natural pacemaker.
- This leads to atrial contraction, followed by ventricular activation via the atrioventricular (AV) node and bundle branches.
- Mechanical events, such as valve openings and closures, produce heart sounds like S1 and S2, correlating with ECG segments.
- Hormonal influences, including epinephrine from the adrenal glands, can modulate cycle duration and strength.
- Factors like exercise or stress accelerate the cycle, reducing its length while increasing output.
Decoding the ECG Waveform
An ECG traces the heart’s electrical activity through electrodes placed on the skin, producing a graphical representation. Each component of the waveform corresponds to specific cardiac events, aiding in clinical analysis.
- The P wave initiates the trace, reflecting SA node firing and atrial excitation.
- The PR interval measures conduction time from atria to ventricles, normally 120-200 milliseconds.
- The QRS complex, lasting about 80-120 milliseconds, depicts ventricular depolarization in detail.
- ST segment follows, representing the plateau phase of ventricular action potential.
- The QT interval encompasses ventricular depolarization and repolarization, adjusted for heart rate using formulas like Bazett’s.
Phases of Atrial Activity in the Cycle
Atrial activity forms the initial part of the cardiac cycle, focusing on filling and priming the ventricles. It is electrically marked by the P wave and mechanically by contraction and relaxation.
- During atrial diastole, blood passively enters from the vena cava and pulmonary veins.
- Atrial systole adds the final volume, especially important in conditions like atrial fibrillation where this kick is lost.
- The atria act as reservoirs, conduits, and boosters, roles that vary with cycle phases.
- Electrical impulses ensure synchronous atrial contraction, preventing inefficiencies.
- Volume changes in atria influence ventricular preload via the Frank-Starling mechanism.
Ventricular Phases and Their Significance
Ventricular phases dominate the cardiac cycle, handling the bulk of pumping work. They begin with depolarization and end with repolarization, visible as QRS and T waves.
- Isovolumetric contraction occurs early in systole, with closed valves building pressure.
- Ejection phase follows, expelling blood through open aortic and pulmonary valves.
- Isovolumetric relaxation initiates diastole, allowing pressure drop before filling.
- Rapid ventricular filling happens as mitral and tricuspid valves open.
- Diastasis, a slower filling period, precedes atrial systole’s contribution.
Integration of Electrical and Mechanical Events
The seamless integration of electrical and mechanical events defines cardiac efficiency. The ECG serves as a timeline for these interactions, from impulse generation to muscle response.
- The conduction system, including SA node, AV node, and Purkinje fibers, orchestrates timing.
- Calcium ions play a pivotal role in excitation-contraction coupling within myocytes.
- Autonomic nervous system modulation affects cycle parameters, with sympathetic input increasing contractility.
- Pathophysiological disruptions, like AV blocks, can desynchronize events.
- Advanced imaging, such as echocardiography, complements ECG for visualizing mechanics.
Clinical Relevance of ECG and Cycle Analysis
Analyzing the cardiac cycle via ECG is crucial for healthcare professionals in various settings. It provides diagnostic clues and guides therapeutic interventions.
- Normal sinus rhythm indicates healthy cycle progression.
- Variations in wave morphology can suggest ischemia or electrolyte disturbances.
- Heart rate calculation from R-R intervals assesses tachycardia or bradycardia.
- Exercise stress tests evaluate cycle adaptations under load.
- Pharmacological agents, like beta-blockers, influence cycle components.
In conclusion, the cardiac cycle and its ECG representation form the cornerstone of cardiovascular physiology, illustrating the heart’s remarkable coordination. Mastering this relationship enhances our appreciation of the body’s pumping mechanism and its adaptability to demands. Continued study of these elements fosters deeper insights into maintaining heart health and addressing potential irregularities.

