Explore the fascinating world of heart sounds through phonocardiograms, a crucial diagnostic tool in cardiology. This guide deciphers the various waveforms representing normal and abnormal cardiac conditions, offering insights into conditions like aortic stenosis, mitral regurgitation, and patent ductus arteriosus. Delve into the intricate symphony of the heart and learn how these visual representations aid in identifying underlying cardiovascular issues.
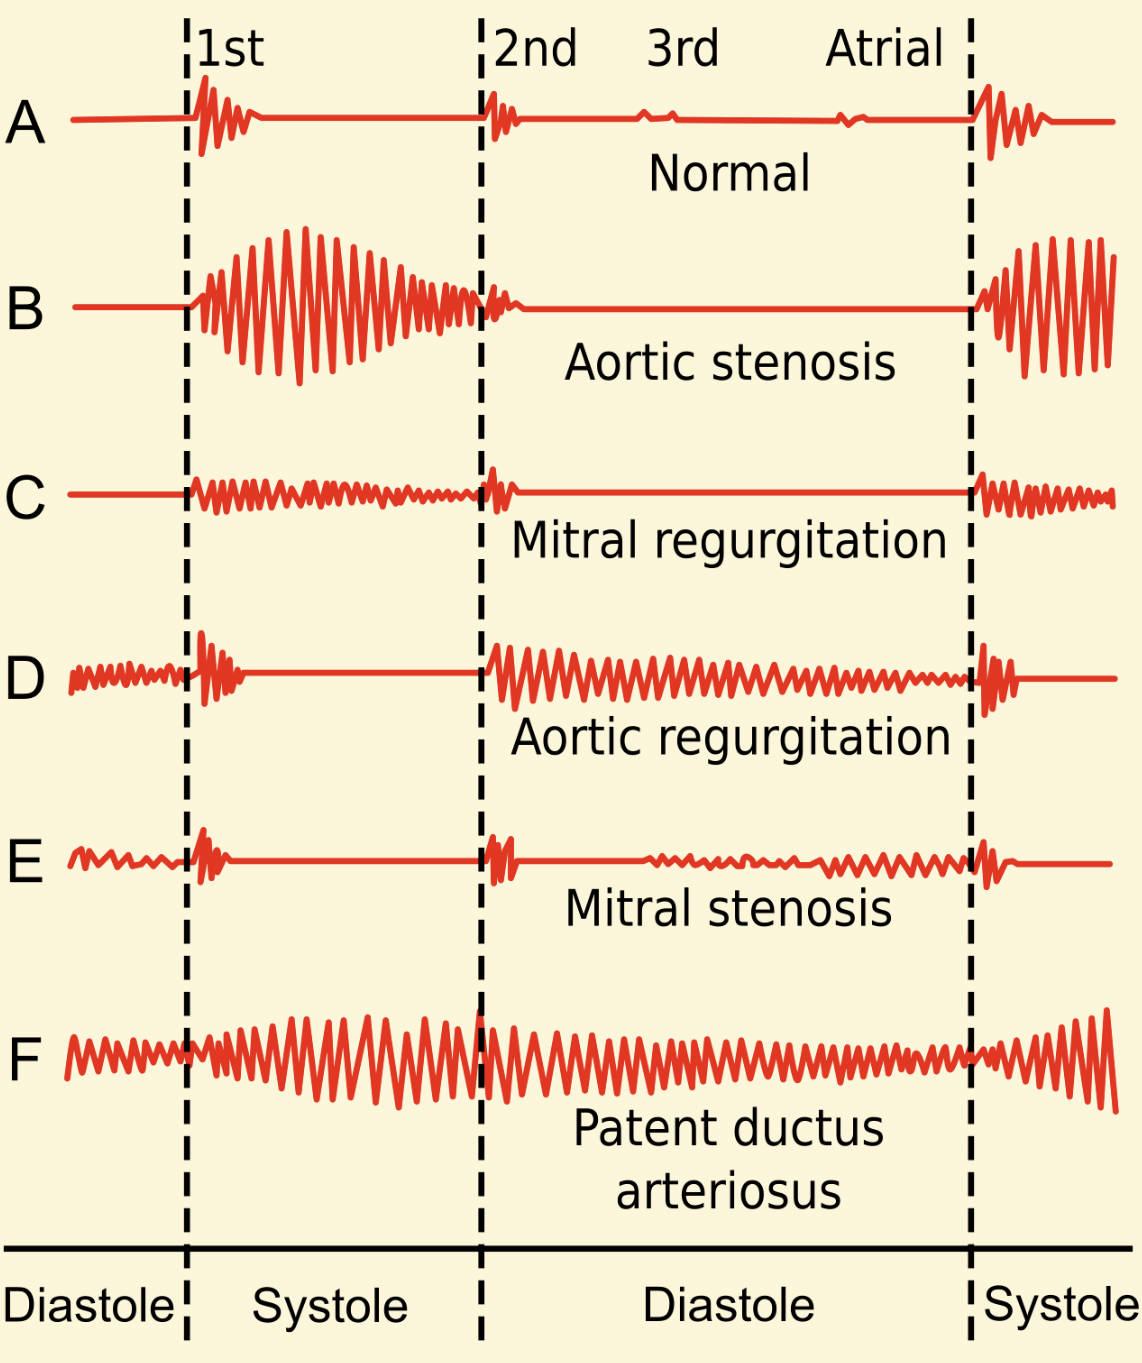
1st: This represents the first heart sound (S1), which marks the beginning of systole. It is primarily caused by the closure of the atrioventricular (mitral and tricuspid) valves, indicating the start of ventricular contraction.
2nd: This signifies the second heart sound (S2), marking the end of systole and the beginning of diastole. S2 is produced by the closure of the semilunar (aortic and pulmonic) valves as the ventricles relax.
3rd: The third heart sound (S3), when present, occurs early in diastole. It is a low-frequency sound often associated with rapid ventricular filling, and while sometimes benign in younger individuals, it can indicate ventricular dysfunction in adults.
Atrial: This refers to the atrial sound, also known as the fourth heart sound (S4). It is a low-frequency sound occurring late in diastole, just before S1, caused by atrial contraction pushing blood into a stiff or hypertrophied ventricle.
Normal: This phonocardiogram illustrates typical heart sounds, showcasing a clear S1 and S2, with distinct intervals between them. A normal heart sound pattern indicates proper functioning of the cardiac valves and efficient blood flow through the heart.
Aortic stenosis: This pattern shows a harsh, crescendo-decrescendo systolic murmur, meaning the sound intensifies and then diminishes during systole. Aortic stenosis is a narrowing of the aortic valve opening, which obstructs blood flow from the left ventricle to the aorta.
Mitral regurgitation: This phonocardiogram displays a holosystolic (pansystolic) murmur, a high-pitched sound that is constant throughout systole. Mitral regurgitation occurs when the mitral valve doesn’t close properly, causing blood to leak backward into the left atrium during ventricular contraction.
Aortic regurgitation: This tracing reveals a decrescendo diastolic murmur, a high-pitched blowing sound that is loudest at the beginning of diastole and fades out. Aortic regurgitation is the leakage of blood back into the left ventricle during diastole due to an incompetent aortic valve.
Mitral stenosis: This phonocardiogram presents a low-pitched, rumbling diastolic murmur, often preceded by an opening snap. Mitral stenosis is a narrowing of the mitral valve orifice, impeding blood flow from the left atrium to the left ventricle.
Patent ductus arteriosus: This distinct pattern shows a continuous, “machinery-like” murmur, audible throughout both systole and diastole. A patent ductus arteriosus (PDA) is a congenital heart defect where a fetal blood vessel, the ductus arteriosus, fails to close after birth, leading to abnormal blood flow between the aorta and pulmonary artery.
The human heart, a marvel of biological engineering, produces a series of characteristic sounds with each beat, often described as a “lub-dub.” These sounds are generated by the closing of heart valves and the turbulent flow of blood. While a skilled clinician can detect many cardiac abnormalities by listening with a stethoscope, a phonocardiogram provides a visual representation of these sounds, offering a more detailed and objective analysis. This diagnostic tool captures the amplitude, frequency, and timing of heart sounds and murmurs, enabling a precise identification of various physiological and pathological conditions.
Understanding the waveforms depicted in a phonocardiogram is fundamental for diagnosing a wide range of cardiovascular diseases. Each tracing offers unique insights into valve function, blood flow dynamics, and the overall health of the heart. For instance, the presence, absence, or altered characteristics of the first and second heart sounds, along with any additional sounds like murmurs, provide critical diagnostic clues. The timing of these sounds relative to the cardiac cycle—systole (ventricular contraction) and diastole (ventricular relaxation)—is also paramount.
- Phonocardiograms provide a visual record of heart sounds.
- They aid in the diagnosis of valvular heart diseases.
- The tracings differentiate between normal and abnormal cardiac activity.
- They help in assessing the severity of heart conditions.
One of the more complex congenital heart defects identified through phonocardiography is patent ductus arteriosus (PDA). This condition arises when the ductus arteriosus, a blood vessel connecting the aorta and the pulmonary artery in a fetus, fails to close shortly after birth. Normally, this vessel shunts blood away from the lungs during fetal development, but its persistence after birth leads to a continuous left-to-right shunt of blood. This shunting results in increased blood flow to the lungs and can lead to pulmonary hypertension and heart failure if left untreated. Clinically, PDA is often characterized by a continuous, “machinery-like” murmur, which is distinctly represented on a phonocardiogram, reflecting the turbulent blood flow through the open duct. Early diagnosis and intervention, often through surgical ligation or transcatheter occlusion, are crucial for preventing long-term complications associated with PDA.
In conclusion, phonocardiograms serve as an invaluable diagnostic aid, translating the complex auditory landscape of the heart into an easily interpretable visual format. By meticulously analyzing the waveforms, cardiologists can identify subtle abnormalities that might otherwise be missed, leading to earlier and more accurate diagnoses of conditions ranging from valvular stenoses and regurgitations to congenital defects like patent ductus arteriosus. This objective visualization of heart sounds significantly enhances our understanding of cardiac mechanics and pathology, ultimately contributing to improved patient care and outcomes in cardiovascular medicine.

