Maintaining vascular homeostasis is essential for ensuring proper blood flow, pressure, distribution, and tissue perfusion throughout the body. This chart outlines the key factors and mechanisms—autoregulatory, neural, and endocrine—that work together to regulate the circulatory system, providing a clear framework for understanding cardiovascular stability.
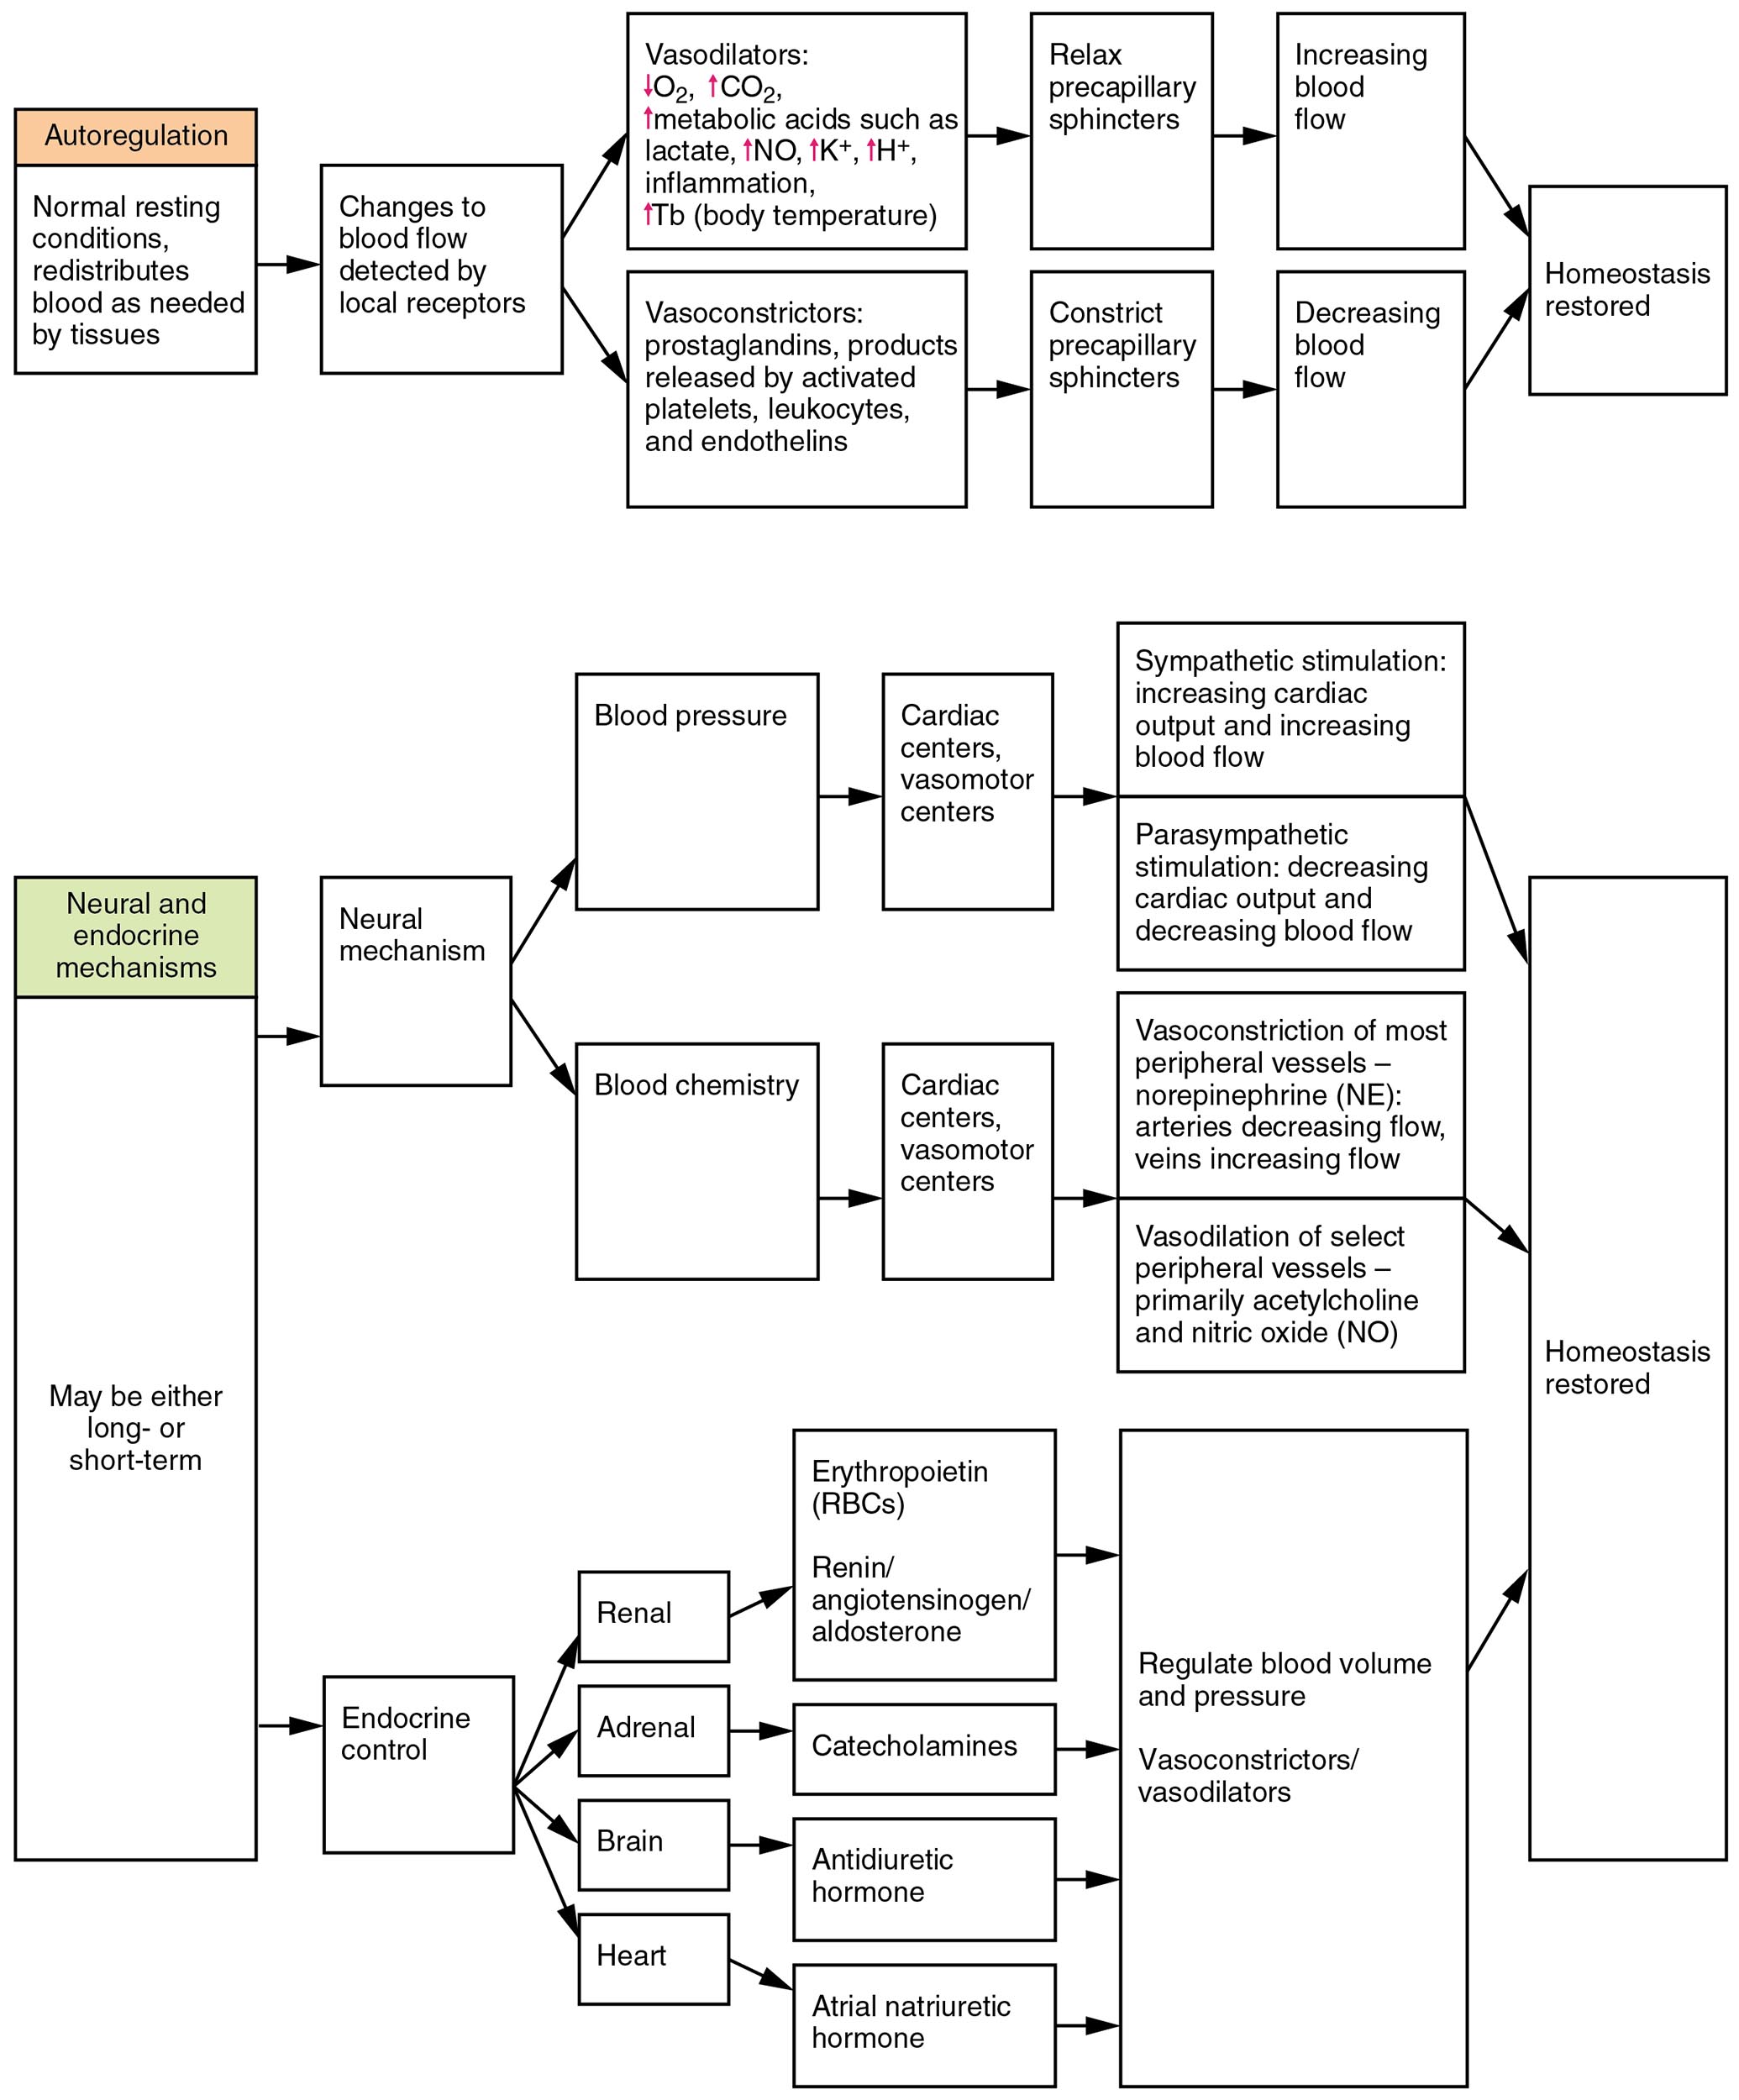
Autoregulatory mechanisms Autoregulatory mechanisms allow tissues to adjust blood flow based on their metabolic needs, such as during exercise or hypoxia. These local responses involve the dilation or constriction of blood vessels, independent of central control, to maintain consistent perfusion.
Neural mechanisms Neural mechanisms involve the autonomic nervous system, particularly the sympathetic and parasympathetic branches, to regulate blood pressure and vessel tone. This system responds rapidly to changes, such as stress or blood loss, by altering heart rate and vascular resistance.
Endocrine mechanisms Endocrine mechanisms utilize hormones like adrenaline, angiotensin II, and aldosterone to modulate blood volume and pressure over longer periods. These chemical signals target kidneys, blood vessels, and the heart to maintain fluid balance and vascular homeostasis.
Blood flow Blood flow refers to the volume of blood moving through vessels per unit time, influenced by vessel diameter and pressure gradients. Adequate flow ensures oxygen and nutrient delivery to tissues, adapting through the mechanisms described.
Blood pressure Blood pressure is the force exerted by blood against vessel walls, regulated to support circulation without damaging tissues. It is maintained within a normal range (e.g., 120/80 mmHg) through a combination of neural and endocrine inputs.
Distribution Distribution describes how blood is allocated to various organs based on demand, such as prioritizing the brain or muscles during activity. This process relies on autoregulatory adjustments and hormonal cues to redirect flow effectively.
Perfusion Perfusion indicates the delivery of blood to capillary beds, ensuring tissue oxygenation and waste removal. It is fine-tuned by all three mechanisms to match metabolic requirements across different physiological states.
Overview of Vascular Homeostasis
This chart provides a snapshot of the intricate balance required to sustain vascular function. Each factor and mechanism plays a distinct yet interconnected role in maintaining circulatory health.
- Autoregulatory mechanisms respond to local tissue signals like carbon dioxide levels.
- Neural mechanisms provide immediate adjustments via the baroreceptor reflex.
- Endocrine mechanisms act over hours or days, influencing fluid retention.
- Blood flow adjusts dynamically, from 5 liters per minute at rest to higher rates during exercise.
- Blood pressure, distribution, and perfusion are optimized to prevent ischemia or edema.
Autoregulatory Mechanisms in Action
Local control through autoregulatory mechanisms ensures tissue-specific blood supply. This process highlights the body’s ability to adapt without central intervention.
- Myogenic responses constrict or dilate vessels in response to pressure changes.
- Metabolic factors, such as adenosine release, dilate vessels in oxygen-deprived tissues.
- These mechanisms maintain perfusion in the brain and kidneys despite fluctuating blood pressure.
- Capillary recruitment increases blood flow to active muscles.
- The process is crucial during exercise, enhancing distribution to working tissues.
Neural Mechanisms and Rapid Response
The neural mechanisms offer a fast-acting system to stabilize circulation. Their role is vital in acute situations requiring immediate adjustment.
- Sympathetic activation increases blood pressure by constricting arterioles.
- Parasympathetic input slows heart rate, fine-tuning blood flow during rest.
- Baroreceptors in the carotid sinus detect changes, triggering reflex responses.
- This system adjusts distribution to prioritize vital organs like the brain.
- Rapid responses prevent drops in perfusion during postural changes.
Endocrine Mechanisms and Long-Term Regulation
Hormonal control via endocrine mechanisms supports sustained vascular balance. These mechanisms address chronic changes in fluid and pressure dynamics.
- Blood pressure is elevated by angiotensin II, constricting vessels and retaining sodium.
- Aldosterone increases blood volume, supporting perfusion over time.
- Adrenaline boosts blood flow to muscles during the “fight or flight” response.
- Antidiuretic hormone (ADH) prevents fluid loss, aiding distribution.
- These hormones stabilize blood pressure and perfusion in dehydration or hemorrhage.
Clinical Relevance of Vascular Homeostasis
Understanding these factors aids in diagnosing and managing circulatory disorders. The interplay of mechanisms offers insights into therapeutic approaches.
- Impaired autoregulatory mechanisms may lead to poor perfusion in diabetes.
- Overactive neural mechanisms can cause hypertension, straining vessel walls.
- Dysfunctional endocrine mechanisms, like excess aldosterone, contribute to edema.
- Monitoring blood flow and distribution helps assess shock or heart failure.
- Balanced blood pressure and perfusion are critical in critical care settings.
In conclusion, the summary of factors maintaining vascular homeostasis chart reveals the sophisticated coordination of autoregulatory mechanisms, neural mechanisms, and endocrine mechanisms to regulate blood flow, blood pressure, distribution, and perfusion. This integrated approach ensures the body adapts to varying demands, from rest to intense activity, supporting overall health. Grasping these principles enhances the ability to address circulatory challenges effectively.

