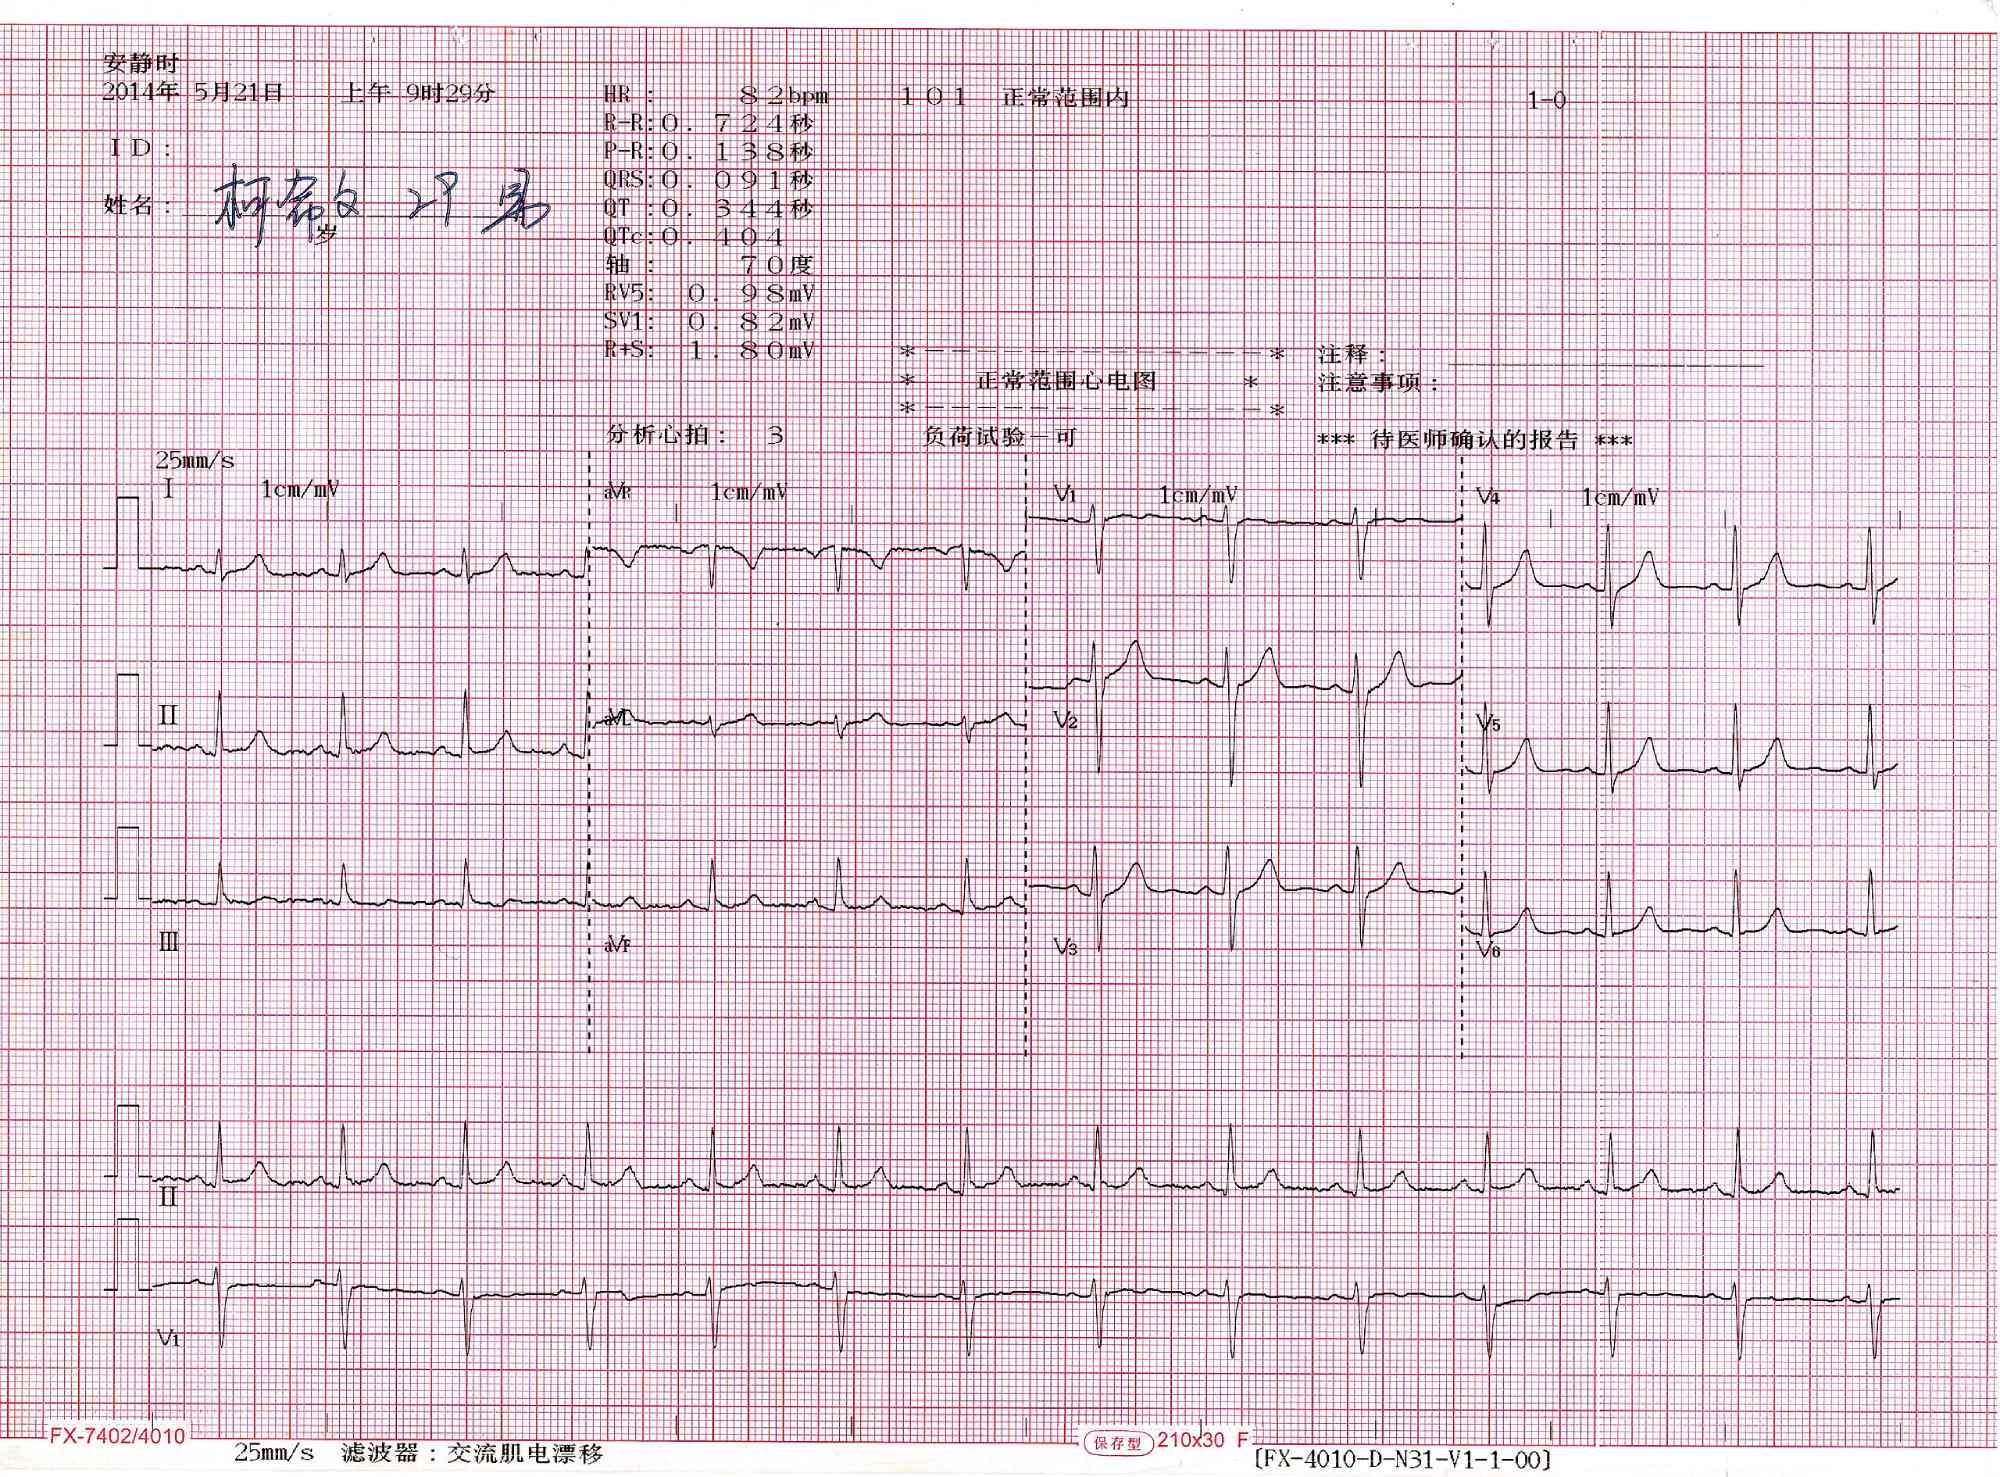
A 12-lead electrocardiogram (ECG) is a fundamental diagnostic tool used in cardiology to visualize the electrical activity of the heart from multiple angles. The image provided displays a standard report generated by a Nihon Kohden Corporation device, showcasing a “Normal Sinus Rhythm.” This printout translates the invisible ionic currents of the cardiac muscle into a graphical format, allowing clinicians to assess heart rate, rhythm, and the integrity of the conduction system. Understanding the layout of the grid, the specific waveforms, and the standard intervals is essential for distinguishing a healthy heart from one experiencing pathology.
Header Data:
Located at the top of the printout, this section displays critical automated calculations performed by the device’s algorithm, including Heart Rate (HR), PR interval, QRS duration, and QT/QTc intervals. In this specific image, the data confirms the patient is within normal physiological ranges, though the text “Unconfirmed Report” indicates that a physician must verify the automated findings.
Grid Background:
The red grid underlying the traces provides the scale for measurement, where the horizontal axis represents time and the vertical axis represents voltage. Standard calibration ensures that one small square represents 0.04 seconds horizontally and 0.1 millivolts vertically, allowing for precise measurement of wave duration and amplitude.
Leads I, II, III:
These three waveforms on the left side of the chart are the standard bipolar limb leads, which measure the electrical potential difference between the right arm, left arm, and left leg. They form the basis of “Einthoven’s Triangle” and are crucial for determining the heart’s electrical axis.
Leads aVR, aVL, aVF:
Situated in the second column, these are the augmented unipolar limb leads. They view the heart’s electrical activity from the perspective of the right shoulder (aVR), left shoulder (aVL), and the feet (aVF), providing additional vertical plane information.
Leads V1–V6:
The six waveforms on the right side of the paper are the precordial or chest leads, which look at the heart in the horizontal plane. Leads V1 and V2 focus on the right ventricle and septum, while V3 through V6 view the anterior and lateral walls of the left ventricle.
Rhythm Strip:
The continuous line at the very bottom of the page (typically Lead II) runs for a longer duration than the other segments. This strip is essential for analyzing the regularity of the heart rhythm over time and identifying any intermittent arrhythmias that short snapshots might miss.
The Anatomy of the 12-Lead ECG
The 12-lead ECG is often described as taking twelve different photographs of the heart at the same time. While a single lead can show that the heart is beating, it cannot pinpoint exactly where a problem lies. By placing electrodes on the limbs and across the chest, the ECG machine triangulates the electrical signal to create a three-dimensional understanding of cardiac function. The leads are grouped anatomically: Leads II, III, and aVF view the inferior (bottom) wall of the heart; Leads I, aVL, V5, and V6 view the lateral (side) wall; and Leads V1 through V4 view the septal and anterior (front) walls.
In the image provided, the tracing represents a healthy adult heart. The medical term for this is “Normal Sinus Rhythm.” This means the electrical impulse is originating correctly in the sinoatrial (SA) node, traveling through the atria, pausing at the AV node, and then spreading efficiently through the ventricles. The uniformity of the waves across all leads suggests there is no enlargement of the heart chambers (hypertrophy) and no evidence of past or present tissue damage (ischemia or infarction).
The automated analysis shown in the header is a hallmark of modern devices like those from Nihon Kohden. These machines use sophisticated algorithms to measure intervals down to the millisecond. For example, the PR interval measures the time it takes for the signal to travel from the atria to the ventricles. If this number were too high, it would indicate a heart block. Similarly, the QRS duration measures how fast the ventricles contract. A wide QRS would suggest a conduction delay, such as a Bundle Branch Block.
- Key components of a normal ECG tracing include:
- Rate: A resting heart rate between 60 and 100 beats per minute.
- Rhythm: A regular distance between consecutive R-waves.
- P Wave: Upright in most leads, indicating the signal comes from the sinus node.
- Segments: An isoelectric (flat) ST segment, indicating no active injury to the heart muscle.
Physiological Basis of the Waveforms
To interpret the squiggly lines on the paper, one must understand the cellular physiology of the heart. The heart is an electromechanical pump; electricity precedes mechanical contraction. The first small bump seen in each cycle is the P wave. This represents atrial depolarization. During this phase, sodium ions rush into the atrial muscle cells, changing their electrical charge and causing the upper chambers to contract and push blood into the ventricles.
Following the P wave is a brief flat line called the PR segment. This silence is physiologically vital. It represents a deliberate delay at the atrioventricular (AV) node. If the electrical signal went straight to the ventricles immediately, the heart would contract before it was full of blood. This delay allows the ventricles to fill completely, maximizing cardiac output.
The largest spike on the graph is the QRS complex. This represents ventricular depolarization. Because the ventricles are the main pumping chambers and contain the most muscle mass, they generate the strongest electrical signal, resulting in a tall spike. Finally, the wave that follows is the T wave, which represents ventricular repolarization. This is the “recharging” phase where ions move back to their resting positions (primarily potassium exiting the cell), preparing the heart for the next beat. The QT interval serves as a measure of this total electrical cycle duration; if the QT interval becomes too long, the heart becomes vulnerable to dangerous arrhythmias.
Conclusion
The 12-lead ECG remains the gold standard for initial cardiac evaluation due to its non-invasive nature and the depth of information it provides. The “Normal 12-lead” image serves as a critical baseline against which all pathology is compared. By systematically analyzing the rate, rhythm, axis, and morphology of the P-QRS-T sequence, healthcare providers can gain immediate insight into the anatomical and physiological state of the heart. While automated interpretations provide a helpful starting point, the skilled eye of a clinician is required to integrate these electrical patterns with the patient’s clinical presentation.

