A standard 12-lead electrocardiogram (ECG) provides a comprehensive view of the heart’s electrical activity by grouping leads into specific anatomical territories. This guide details the spatial arrangement of the limb and precordial leads—Lateral, Inferior, Septal, and Anterior—enabling clinicians to localize myocardial ischemia and injury with precision by correlating electrical waveforms with the underlying cardiac muscle and vascular supply.
I Lateral: Lead I is a bipolar limb lead that measures the potential difference between the right and left arms, viewing the high lateral wall of the left ventricle. It is often analyzed in conjunction with lead aVL to detect ischemia in the territory supplied by the circumflex artery.
II Inferior: Lead II is a bipolar limb lead looking at the inferior surface of the heart from the right arm to the left leg. It typically shows the largest positive deflection in a normal heart and is crucial for monitoring sinus rhythm and inferior wall health.
III Inferior: Lead III is another bipolar lead oriented towards the right inferior aspect of the heart, connecting the left arm to the left leg. Along with leads II and aVF, it helps diagnose inferior myocardial infarctions, which are often associated with the right coronary artery.
aVR: Lead aVR (augmented Vector Right) views the heart from the right shoulder and does not group into a specific contiguous wall territory like the others. It primarily shows reciprocal changes to the lateral leads and can indicate left main coronary artery occlusion or proximal LAD disease.
aVL Lateral: Lead aVL (augmented Vector Left) provides a unipolar view of the high lateral wall from the perspective of the left shoulder. ST-segment elevation in this lead often points to a blockage in the high lateral branches of the coronary circulation.
aVF Inferior: Lead aVF (augmented Vector Foot) looks directly up at the inferior wall of the heart from the left leg. It completes the inferior triad (II, III, aVF) and is essential for assessing the inferior myocardium and the diaphragmatic surface of the heart.
V1 Septal: Lead V1 is a precordial lead placed at the fourth intercostal space, right of the sternum. It specifically monitors the interventricular septum and is vital for distinguishing bundle branch blocks and right ventricular hypertrophy.
V2 Septal: Lead V2 sits at the fourth intercostal space, left of the sternum, viewing the septum alongside V1. It is a key lead for identifying anteroseptal infarctions and serves as a reference point for posterior wall reciprocal changes.
V3 Anterior: Lead V3 is located between V2 and V4, transitioning from septal to anterior views. It monitors the anterior wall of the left ventricle and is highly sensitive to changes in the left anterior descending (LAD) artery territory.
V4 Anterior: Lead V4 is placed at the midclavicular line in the fifth intercostal space, looking directly at the cardiac apex. As an anterior lead, it is essential for detecting apical ischemia and works in concert with V3 to identify anterior wall insults.
V5 Lateral: Lead V5 is positioned at the anterior axillary line, viewing the low lateral wall of the left ventricle. It captures the bulk of left ventricular depolarization and is frequently used to assess voltage criteria for ventricular hypertrophy.
V6 Lateral: Lead V6 sits at the midaxillary line, providing a view of the lateral wall furthest to the left. Together with I, aVL, and V5, it offers a complete picture of the lateral myocardium and circumflex artery distribution.
Decoding the Contiguous Lead System
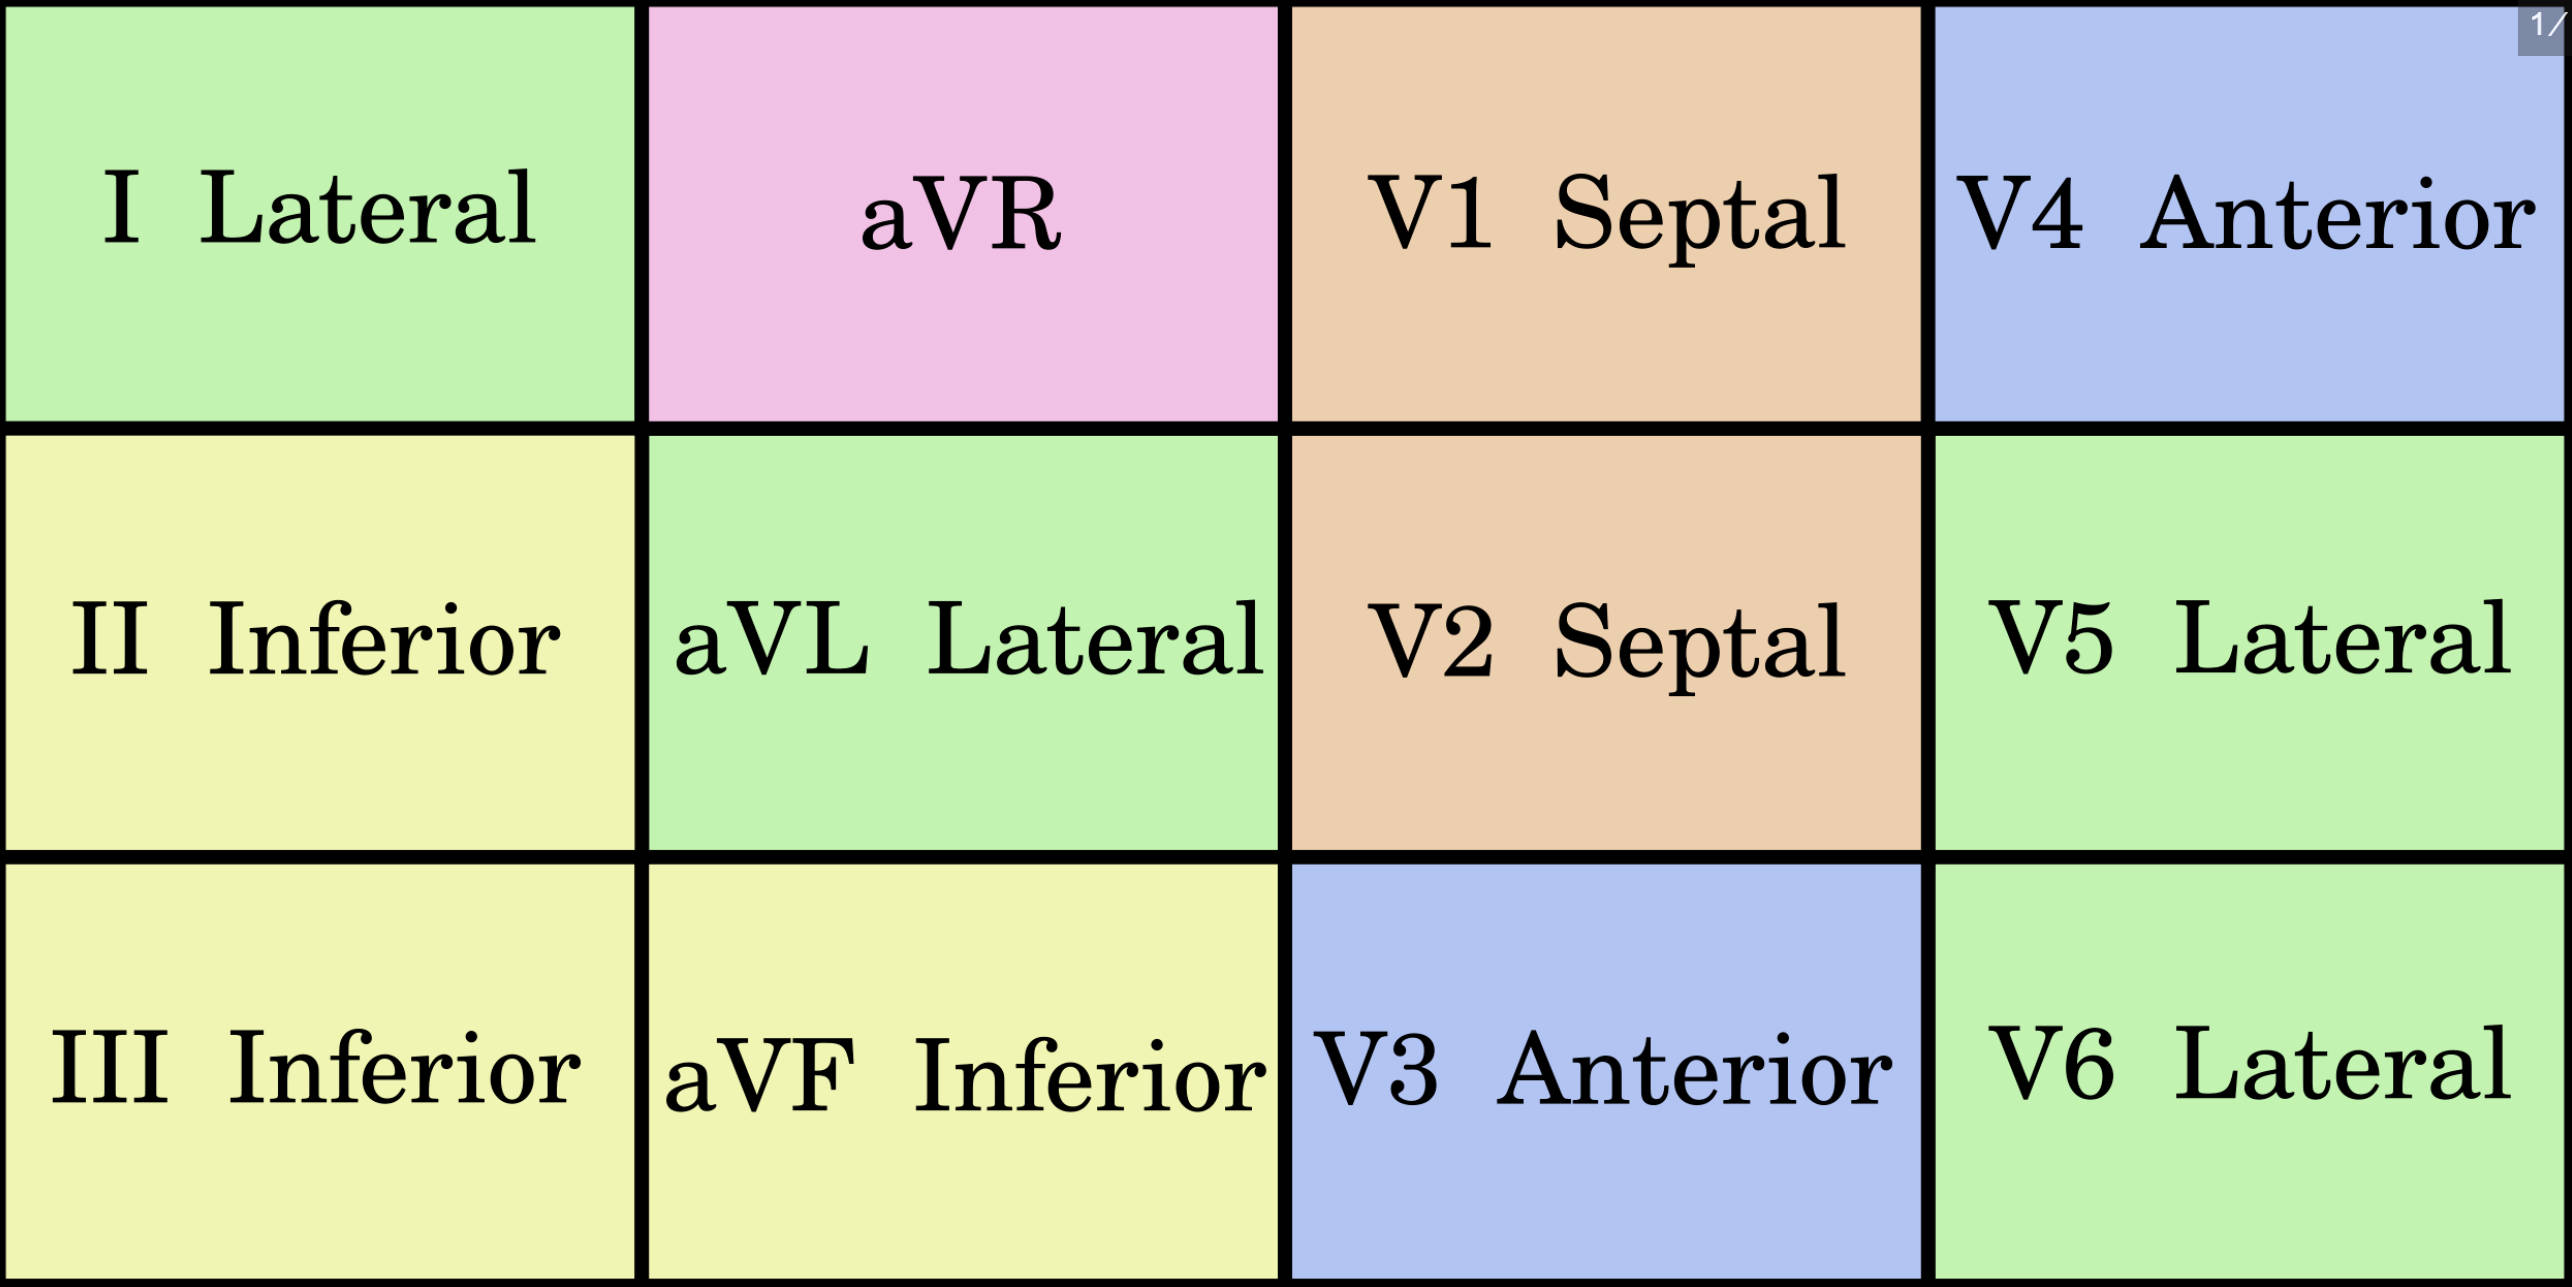
The matrix presented in the image organizes the 12 leads not by their numerical sequence, but by the “neighborhood” of the heart they monitor. This arrangement represents the concept of contiguous leads—groups of leads that look at the same anatomical surface of the ventricle. While the limb leads (I, II, III, aVR, aVL, aVF) view the heart in the frontal plane, the precordial leads (V1–V6) view the heart in the horizontal plane. By combining these views, a clinician can mentally reconstruct a three-dimensional model of the heart’s electrical activity.
Understanding these groupings is fundamental to cardiac diagnostics because pathology rarely affects a single lead in isolation. For diagnostic confidence, changes such as ST-segment elevation or depression must appear in two or more contiguous leads. For example, the inferior leads (II, III, aVF) view the diaphragmatic surface of the heart, while the septal leads (V1, V2) view the fibrous wall separating the ventricles. This anatomical clustering allows medical professionals to predict which coronary artery is blocked based on where the electrical distortion appears on the grid.
The standard groupings for localization are as follows:
- Inferior Wall: Leads II, III, and aVF (Right Coronary Artery).
- Lateral Wall: Leads I, aVL, V5, and V6 (Left Circumflex Artery).
- Septal Wall: Leads V1 and V2 (Left Anterior Descending Artery).
- Anterior Wall: Leads V3 and V4 (Left Anterior Descending Artery).
Clinical Correlation: Myocardial Infarction and Vascular Anatomy
The primary clinical application of this color-coded grid is the rapid identification of myocardial infarction (heart attack). When a coronary artery is occluded, the muscle tissue it supplies becomes ischemic and eventually necrotic, altering the electrical signals recorded by the overlying leads. For instance, an occlusion of the Left Anterior Descending (LAD) artery—often called the “widowmaker”—typically results in ST elevation in the septal (V1, V2) and anterior (V3, V4) leads. Because the LAD supplies a massive amount of heart muscle, recognition of this pattern is critical for immediate intervention.
Conversely, the lateral leads (I, aVL, V5, V6) monitor the territory usually supplied by the Left Circumflex Artery. An infarction here might present more subtly than an anterior, massive event but carries significant risk to the pumping function of the left ventricle. Meanwhile, the inferior leads (II, III, aVF) correlate with the Right Coronary Artery (RCA) in most patients. Inferior wall infarctions require specific management strategies, as they can involve the right ventricle and are preload-dependent; administering nitrates to these patients can cause dangerous hypotension. Therefore, recognizing the “Yellow” inferior section of the grid is a vital safety check in acute cardiac care.
The Role of aVR in Diagnosis
While most leads are grouped into distinct anatomical walls, lead aVR stands somewhat apart. Often ignored, aVR provides unique insights into the right upper side of the heart. Global ST depression with ST elevation in aVR is a strong predictor of Left Main Coronary Artery occlusion or severe triple-vessel disease. Furthermore, aVR is essential for verifying lead placement; in a normal sinus rhythm, the P-wave and QRS complex in aVR should be negative. If they are positive, it often indicates that the limb leads were placed on the wrong arms.
In conclusion, the 12-lead ECG is more than just a collection of lines; it is a structured map of cardiac anatomy. By understanding the relationships depicted in the image—how lateral, inferior, septal, and anterior leads correspond to specific coronary arteries and myocardial walls—clinicians can diagnose heart conditions with high specificity. This anatomical approach transforms abstract electrical signals into actionable clinical data, guiding life-saving treatments like catheterization and reperfusion therapy.

