Delve into the intricate, rhythmic sequence of events that constitute the human cardiac cycle, as vividly described in this detailed diagram. This guide will illuminate how the heart efficiently pumps blood through a continuous process of contraction and relaxation, ensuring vital oxygen and nutrients reach every part of the body. Understanding the phases of the cardiac cycle is fundamental to comprehending heart function and identifying various cardiovascular conditions.
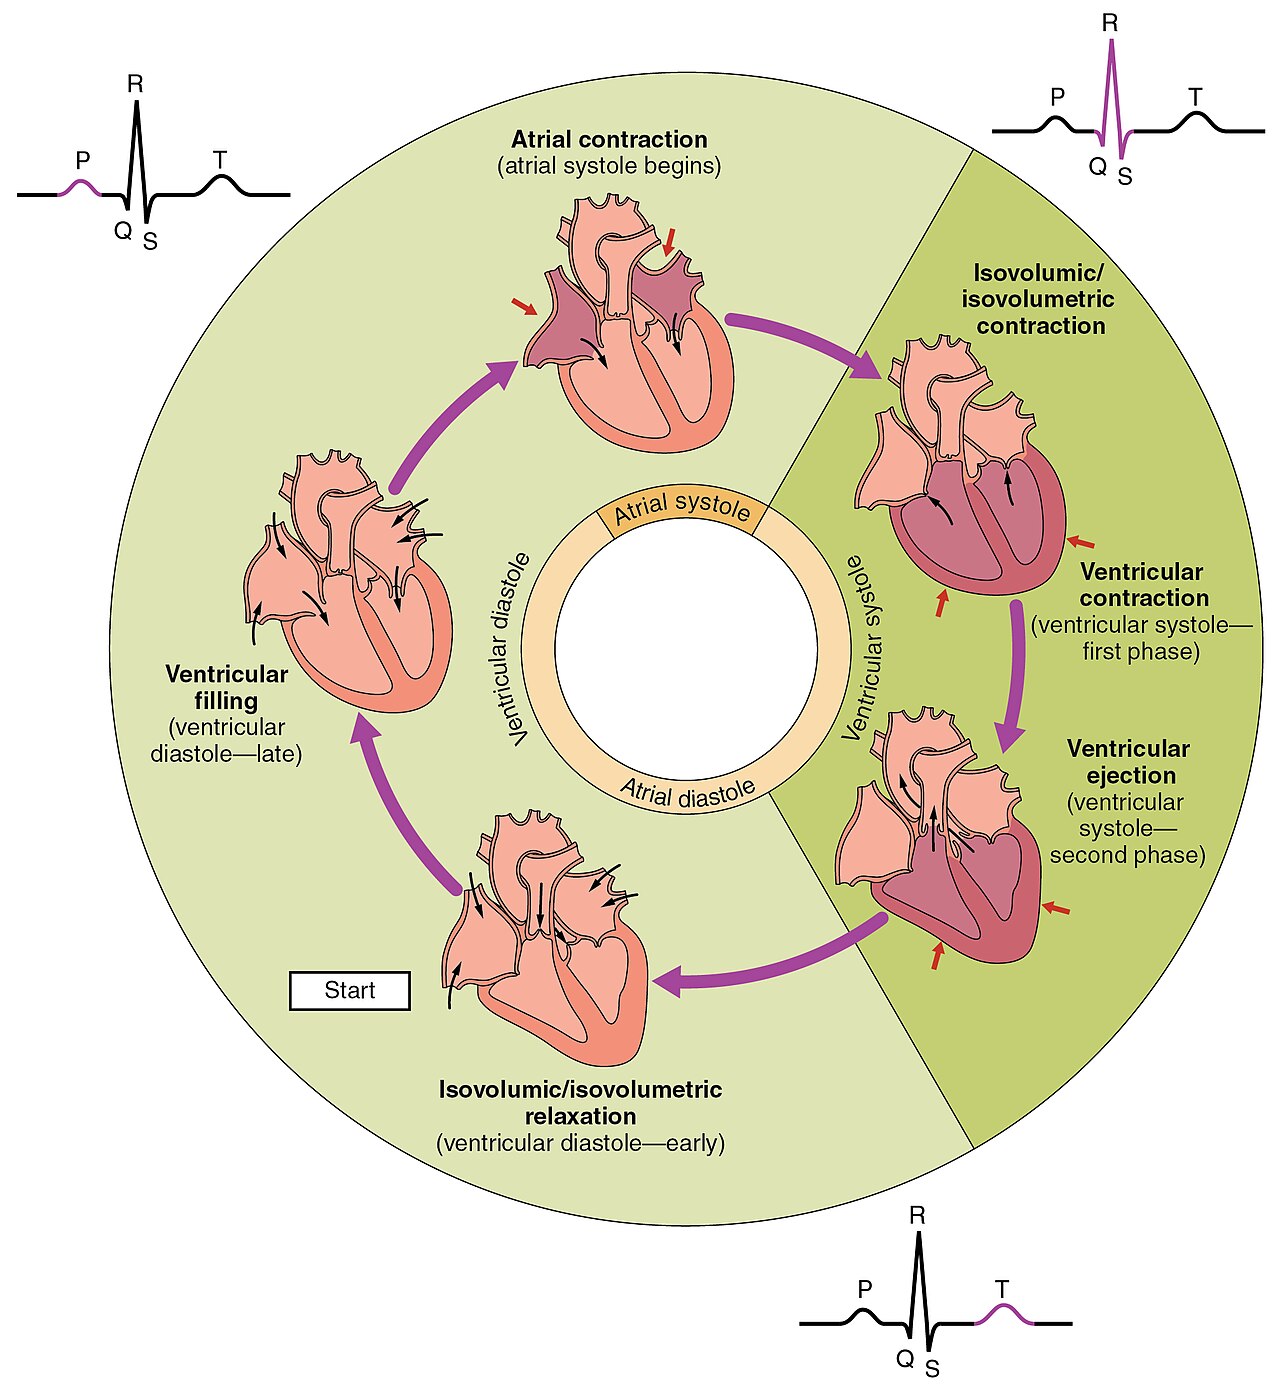
This diagram meticulously outlines the phases of the human cardiac cycle, correlating them with the electrical activity represented in an electrocardiogram (ECG).
P Wave (ECG): The P wave represents atrial depolarization, which leads to atrial contraction. This electrical event precedes the mechanical contraction of the atria.
QRS Complex (ECG): The QRS complex represents ventricular depolarization, triggering ventricular contraction. This large wave signifies the electrical impulse spreading through the ventricles.
T Wave (ECG): The T wave represents ventricular repolarization, which corresponds to the relaxation of the ventricles. This electrical event allows the ventricles to refill with blood.
Atrial contraction (atrial systole begins): This phase immediately follows atrial depolarization (P wave) where the atria contract, pushing the remaining blood into the ventricles. It contributes approximately 20-30% of ventricular filling.
Isovolumic/isovolumetric contraction (ventricular systole – first phase): During this brief period, the ventricles begin to contract, but all heart valves (atrioventricular and semilunar) are closed. This causes a rapid increase in ventricular pressure without a change in blood volume.
Ventricular ejection (ventricular systole – second phase): As ventricular pressure surpasses arterial pressure, the semilunar valves (aortic and pulmonary) open, and blood is rapidly ejected from the ventricles into the aorta and pulmonary artery. This is the primary phase of blood delivery to the body and lungs.
Isovolumic/isovolumetric relaxation (ventricular diastole – early): Following ventricular ejection, the ventricles relax, and the semilunar valves close to prevent backflow. For a short period, all valves are closed, and ventricular pressure drops rapidly without a change in volume.
Ventricular filling (ventricular diastole – late): As ventricular pressure falls below atrial pressure, the atrioventricular valves (mitral and tricuspid) open, allowing blood to passively flow from the atria into the ventricles. This is the main phase of ventricular filling, occurring largely passively before atrial contraction.
Atrial systole: This refers to the period of atrial contraction, as described above, where the atria actively push blood into the ventricles. It is a part of the larger cardiac cycle, contributing to the final filling of the ventricles.
Ventricular systole: This encompasses the phases of isovolumic contraction and ventricular ejection, representing the period when the ventricles contract to pump blood out of the heart. It is the powerful pumping phase of the cardiac cycle.
Atrial diastole: This refers to the period of atrial relaxation, during which the atria fill with blood from the great veins (superior/inferior vena cava for the right atrium, pulmonary veins for the left atrium). It largely overlaps with ventricular systole and early diastole.
Ventricular diastole: This encompasses the phases of isovolumic relaxation and ventricular filling, representing the period when the ventricles relax and fill with blood. It is the resting and filling phase of the cardiac cycle.
The human heart operates through a precisely orchestrated sequence of events known as the cardiac cycle. This cycle, which typically lasts about 0.8 seconds at a resting heart rate, involves the coordinated contraction (systole) and relaxation (diastole) of the atria and ventricles. The diagram provides a clear visual representation of how blood flows through the heart in a continuous loop, driven by pressure changes and regulated by the opening and closing of heart valves. Understanding these phases is crucial for grasping cardiac mechanics and identifying the origins of various cardiovascular conditions.
The cycle begins with ventricular filling, where blood passively flows from the atria into the ventricles during ventricular diastole. This is followed by atrial contraction (atrial systole), which gives an extra push to fill the ventricles. Then, as the ventricles begin to contract, they enter the isovolumic contraction phase, where all valves are closed, leading to a rapid pressure increase. Once ventricular pressure exceeds that in the major arteries, the semilunar valves open, initiating ventricular ejection, where blood is forcefully pumped out to the lungs and body.
After ejection, the ventricles relax, entering isovolumic relaxation as the semilunar valves close. This drop in pressure eventually allows the atrioventricular valves to open again, restarting the ventricular filling phase. Each phase is intricately linked to specific electrical events in the heart, measurable by an electrocardiogram (ECG), such as the P wave (atrial depolarization), QRS complex (ventricular depolarization), and T wave (ventricular repolarization). Disruptions in any of these phases or their underlying electrical control can lead to serious cardiac conditions.
- Heart sounds (“lub-dub”) correspond to the closing of the heart valves during specific phases of the cardiac cycle.
- The first heart sound (“lub”) is due to the closing of the atrioventricular valves during isovolumic contraction.
- The second heart sound (“dub”) is due to the closing of the semilunar valves during isovolumic relaxation.
- Cardiac output (volume of blood pumped per minute) is a direct result of the efficiency of the cardiac cycle.
This comprehensive diagram of the human cardiac cycle is an invaluable tool for medical students, healthcare professionals, and anyone interested in cardiovascular physiology. A deep understanding of these synchronized mechanical and electrical events is essential for diagnosing conditions such as heart failure, arrhythmias, or valvular heart disease. By correlating the mechanical phases with the electrical signals, clinicians can precisely pinpoint abnormalities and develop targeted treatment strategies, ultimately contributing to better patient outcomes and improved heart health.

