Decoding the Heartbeat: A Comprehensive Guide to the Wiggers Diagram
Unravel the intricate sequence of events within the cardiac cycle using the Wiggers diagram, a pivotal tool for understanding heart function. This article meticulously explains the interplay of pressure, volume, electrical activity, and heart sounds in the left ventricle, from isovolumic contraction to atrial systole. Gain crucial insights into the physiological mechanisms that orchestrate each heartbeat and maintain life-sustaining circulation.
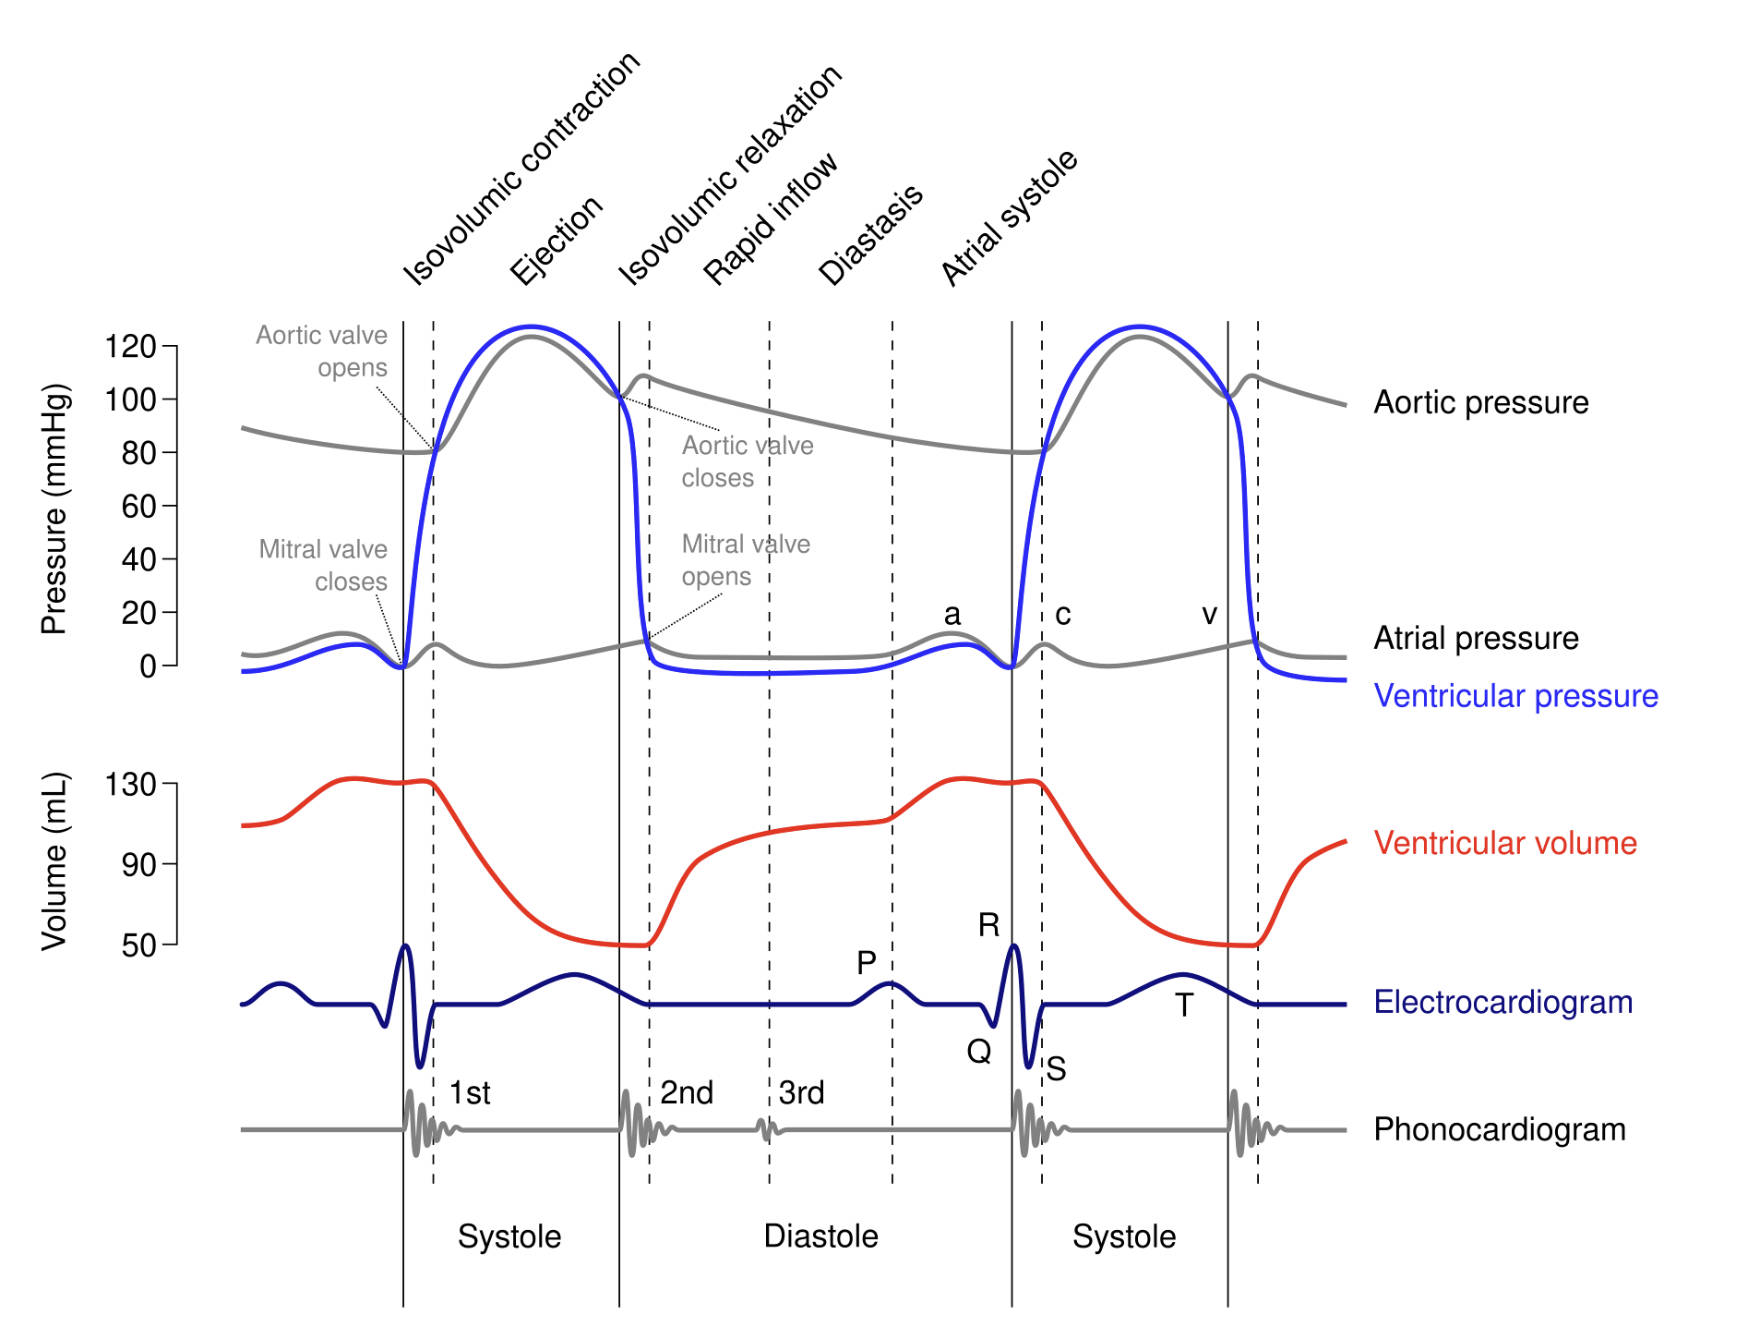
Isovolumic contraction: This phase marks the beginning of ventricular systole, occurring after the mitral valve closes but before the aortic valve opens. During this brief period, the left ventricle contracts, increasing pressure within its chamber without a change in blood volume.
Ejection: Following isovolumic contraction, when ventricular pressure exceeds aortic pressure, the aortic valve opens, and blood is rapidly ejected from the left ventricle into the aorta. This phase represents the primary pumping action of the heart, propelling oxygenated blood to the systemic circulation.
Isovolumic relaxation: This phase occurs at the beginning of ventricular diastole, after the aortic valve closes but before the mitral valve opens. During this period, the left ventricle relaxes, causing a rapid drop in pressure within the chamber while its volume remains constant.
Rapid inflow: Following isovolumic relaxation, as ventricular pressure drops below atrial pressure, the mitral valve opens, allowing blood to rapidly flow from the left atrium into the left ventricle. This is the initial phase of ventricular filling, driven by the pressure gradient.
Diastasis: This is the slower, passive filling phase of the left ventricle that follows rapid inflow. Blood continues to flow from the left atrium into the ventricle as both chambers are relaxed, with the pressure gradient being less pronounced than during rapid inflow.
Atrial systole: This phase represents the contraction of the left atrium, occurring towards the end of ventricular diastole. Atrial systole actively pushes a final volume of blood into the left ventricle, topping off the ventricular volume before the next ventricular contraction.
Aortic valve opens: This event occurs when the pressure in the left ventricle surpasses the pressure in the aorta, signaling the start of the ejection phase. The opening of this semilunar valve allows oxygenated blood to leave the heart and enter the systemic circulation.
Mitral valve closes: This event signifies the beginning of ventricular systole, occurring when ventricular pressure rises above atrial pressure, preventing blood from flowing back into the left atrium. The closure of this atrioventricular valve contributes to the first heart sound (S1).
Aortic valve closes: This event occurs at the end of ventricular ejection, when the pressure in the aorta exceeds the pressure in the relaxing left ventricle. The closure of this semilunar valve prevents backflow of blood into the ventricle and contributes to the second heart sound (S2).
Mitral valve opens: This event occurs during ventricular diastole, when the pressure in the relaxing left ventricle drops below that in the left atrium. The opening of this atrioventricular valve allows for ventricular filling.
Aortic pressure: This plot represents the pressure fluctuations within the aorta throughout the cardiac cycle. It rises during ventricular ejection, falls slowly during diastole as blood flows to the periphery, and shows a dicrotic notch (incisura) as the aortic valve closes.
Atrial pressure: This plot illustrates the pressure changes within the left atrium. It features distinct waves: wave “a” for atrial contraction, wave “c” for the mitral valve bulging during ventricular contraction, and wave “v” for passive atrial filling before mitral valve opening.
Ventricular pressure: This plot shows the dynamic pressure changes within the left ventricle. It rises sharply during isovolumic contraction and ejection, peaks during systole, and falls significantly during isovolumic relaxation and filling.
Ventricular volume: This plot tracks the changes in blood volume within the left ventricle throughout the cardiac cycle. It increases during filling (diastole) and decreases during ejection (systole).
Electrocardiogram (ECG): This recording of the electrical activity of the heart provides a crucial temporal marker for cardiac events. Wave “P” corresponds to atrial depolarization, waves “QRS” represent ventricular depolarization, and wave “T” signifies ventricular repolarization.
Phonocardiogram: This represents the sounds generated by the heart during its cycle. The sound labeled “1st” contributes to the S1 heart sound, caused by the closure of the mitral and tricuspid valves, marking the start of systole. The sound labeled “2nd” contributes to the S2 heart sound, caused by the closure of the aortic and pulmonary valves, marking the end of systole and the beginning of diastole.
Systole: This term refers to the contraction phase of the cardiac cycle, during which the ventricles pump blood out of the heart. It includes isovolumic contraction and ejection.
Diastole: This term refers to the relaxation and filling phase of the cardiac cycle, during which the ventricles relax and fill with blood. It includes isovolumic relaxation, rapid inflow, diastasis, and atrial systole.
The cardiac cycle is a precisely choreographed sequence of mechanical and electrical events that enable the heart to pump blood efficiently throughout the body. Understanding this cycle is fundamental to cardiovascular physiology and clinical cardiology. The Wiggers diagram, a classic representation, integrates various physiological parameters—ventricular pressure, ventricular volume, aortic pressure, atrial pressure, electrocardiogram (ECG), and phonocardiogram—against a common timeline, specifically focusing on the events occurring in the left ventricle. This comprehensive diagram provides a powerful visual tool for clinicians and students alike to grasp the complex interplay between electrical excitation and mechanical contraction, ensuring optimal blood flow.
Each phase of the cardiac cycle is tightly regulated, ensuring that blood moves in a unidirectional manner and that the heart chambers fill and eject blood at appropriate times. For instance, the electrical events recorded by the electrocardiogram (ECG) precede the mechanical contractions, with the P wave initiating atrial systole and the QRS complex triggering ventricular systole. These electrical signals are crucial for coordinating the sequential activation of the atria and ventricles. The mechanical events, in turn, manifest as changes in pressure and volume within the heart chambers and great vessels, which can be monitored through invasive and non-invasive methods.
The heart sounds, represented by the phonocardiogram, are acoustic manifestations of valvular closure, providing vital diagnostic clues. The first heart sound (S1) is primarily associated with the closure of the atrioventricular valves (mitral and tricuspid), signifying the onset of ventricular systole. The second heart sound (S2) corresponds to the closure of the semilunar valves (aortic and pulmonary), marking the end of ventricular systole and the beginning of diastole. Deviations from normal heart sounds can indicate valvular dysfunction or other cardiac abnormalities, making the Wiggers diagram an indispensable tool for interpreting these complex physiological signals.
Key events integrated in the Wiggers Diagram:
- Pressure Changes: Aortic, atrial, and ventricular pressures.
- Volume Changes: Ventricular volume fluctuations.
- Electrical Activity: ECG waves (P, QRS, T).
- Heart Sounds: Phonocardiogram (S1, S2).
- Valvular Events: Opening and closing of mitral and aortic valves.
- Phases of Cycle: Systole (isovolumic contraction, ejection) and Diastole (isovolumic relaxation, rapid inflow, diastasis, atrial systole).
In conclusion, the Wiggers diagram serves as an invaluable and comprehensive tool for dissecting the intricate sequence of events that constitute the cardiac cycle. By integrating pressure, volume, electrical activity, and heart sounds from the left ventricle, it provides a holistic understanding of how the heart functions as an efficient pump. This detailed insight into each phase, from atrial systole to ejection, is essential for medical professionals in diagnosing and managing a wide array of cardiovascular conditions, ultimately contributing to the advancement of cardiac care and patient well-being.

