The jugular venous pressure (JVP) waveform is a vital clinical tool used by healthcare professionals to assess the pressure in the right atrium and the overall performance of the right side of the heart. By observing the distinct waves and descents of the jugular venous pulse, clinicians can gain indirect yet significant insights into central venous pressure and hemodynamics without the need for immediate invasive monitoring.
The jugular venous pressure waveform reflects the pressure changes within the right atrium throughout the cardiac cycle. Because the internal jugular vein lacks valves as it enters the superior vena cava and right atrium, it acts as a “manometer” for right heart activity. Clinicians typically observe the right internal jugular vein because it has a more direct anatomical path to the right atrium compared to its left-sided counterpart.
Accurate assessment of the JVP requires careful positioning of the patient, usually with the head of the bed at a 45-degree angle. By identifying the characteristic “flicker” of the venous pulse, which is biphasic or triphasic, practitioners can differentiate it from the single-phase carotid arterial pulse. This physical examination technique is fundamental in diagnosing various cardiovascular conditions, ranging from valvular heart disease to pericardial effusion.
Key components evaluated during JVP assessment include:
- The height of the pulsation relative to the sternal angle (angle of Louis).
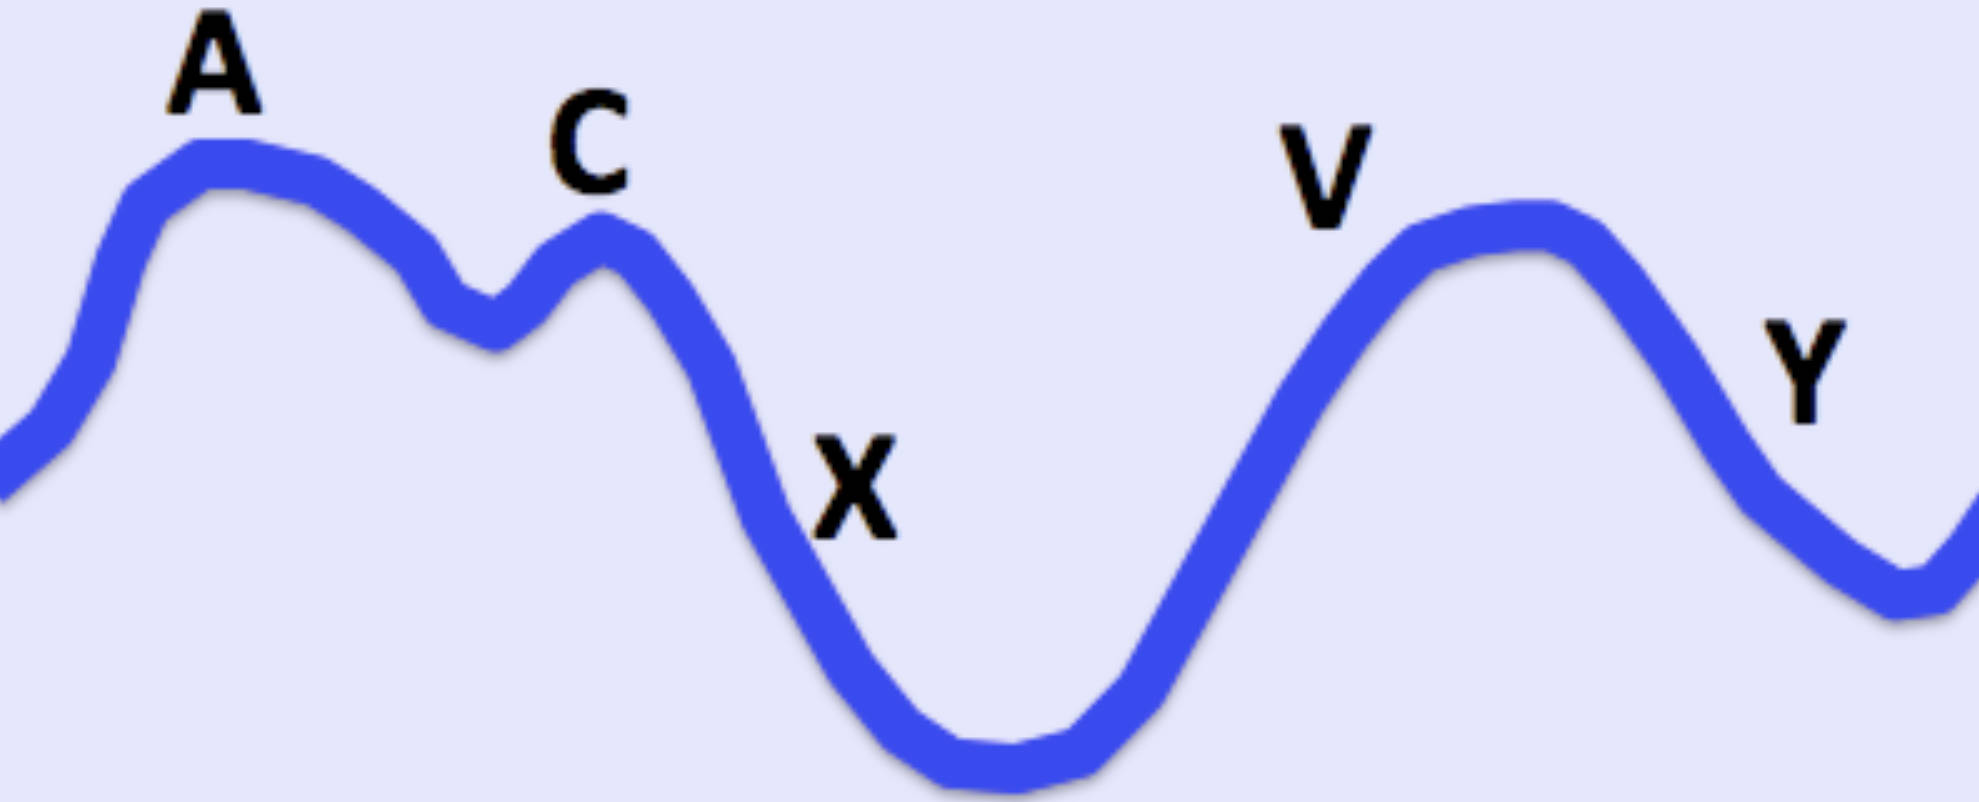
- The specific morphology of the waves (A, C, and V) and the descents (X and Y).
- The presence of hepatojugular reflux when abdominal pressure is applied.
- Changes in the waveform height during the respiratory cycle.
A: The A wave represents the pressure increase caused by right atrial contraction during the end of diastole. It occurs just before the first heart sound (S1) and corresponds to the P wave seen on a standard electrocardiogram.
C: The C wave is a small, often subtle positive deflection that occurs early in ventricular systole. It is caused by the tricuspid valve bulging back into the right atrium as the right ventricle begins to contract and generate pressure.
X: The X descent, also known as the systolic collapse, follows the C wave and represents the reduction in atrial pressure during ventricular contraction. This drop occurs as the atrium relaxes and the tricuspid valve apparatus is pulled downward by the contracting ventricle, effectively increasing atrial volume.
V: The V wave signifies the rise in atrial pressure as blood returns to the right atrium from the systemic circulation while the tricuspid valve remains closed. This wave reaches its peak just before the tricuspid valve opens again at the start of diastole.
Y: The Y descent, or diastolic collapse, occurs when the tricuspid valve opens, allowing blood to flow rapidly from the right atrium into the right ventricle. This rapid emptying causes a sudden drop in atrial pressure, forming the second downward slope of the visible waveform.
Physiological Variations and Waveform Analysis
Understanding the physiological basis of these waves allows for the identification of pathological states. For instance, tricuspid regurgitation causes a significant alteration in the waveform; the X descent may disappear, replaced by a prominent, fused “CV” wave as blood flows backward from the ventricle into the atrium during systole. Conversely, in conditions like tricuspid stenosis, the A wave becomes exceptionally large because the atrium must contract with more force against a restricted opening.
Another critical observation is Kussmaul’s sign, which is characterized by a paradoxical rise in JVP during inspiration. Normally, the JVP should fall during inspiration due to the negative intrathoracic pressure pulling blood into the heart. However, in constrictive pericarditis or restrictive cardiomyopathy, the stiff heart cannot accommodate the extra blood volume, leading to an increase in venous pressure that is reflected in the neck.
Clinical Application in Bedside Diagnosis
The Y descent also provides specific clues regarding ventricular filling. A sharp, rapid Y descent is often seen in constrictive pericarditis, reflecting the sudden stop in ventricular filling when the blood hits the rigid, non-compliant pericardium. In contrast, a slow or blunted Y descent may indicate an obstruction to right ventricular filling, such as that seen in cardiac tamponade or tricuspid stenosis.
By mastering these visual cues, clinicians can significantly enhance their diagnostic accuracy at the bedside. While modern imaging like echocardiography provides detailed structural data, the JVP offers real-time physiological information that is readily accessible and cost-effective. Consistent practice in identifying these specific waves and descents ensures that healthcare providers can detect early signs of cardiac dysfunction and tailor treatment plans effectively.
The jugular venous pressure waveform remains an indispensable element of the physical examination, bridging the gap between clinical observation and complex hemodynamics. While high-tech diagnostic tools are essential, the ability to read the JVP waveform allows for immediate bedside assessment of a patient’s fluid status and cardiac health. This mastery of traditional physical signs continues to be a hallmark of skilled clinical practice in modern medicine.

