The electrocardiogram (ECG or EKG) is one of the most fundamental diagnostic tools in modern cardiology, offering a visual representation of the heart’s electrical activity. By analyzing the distinct waveforms and intervals of a normal sinus rhythm, medical professionals can evaluate cardiac health, diagnose arrhythmias, and assess the efficiency of blood flow through the heart chambers. This article breaks down the anatomy of a single heartbeat as seen on a tracing, explaining the physiological events behind each peak and valley.
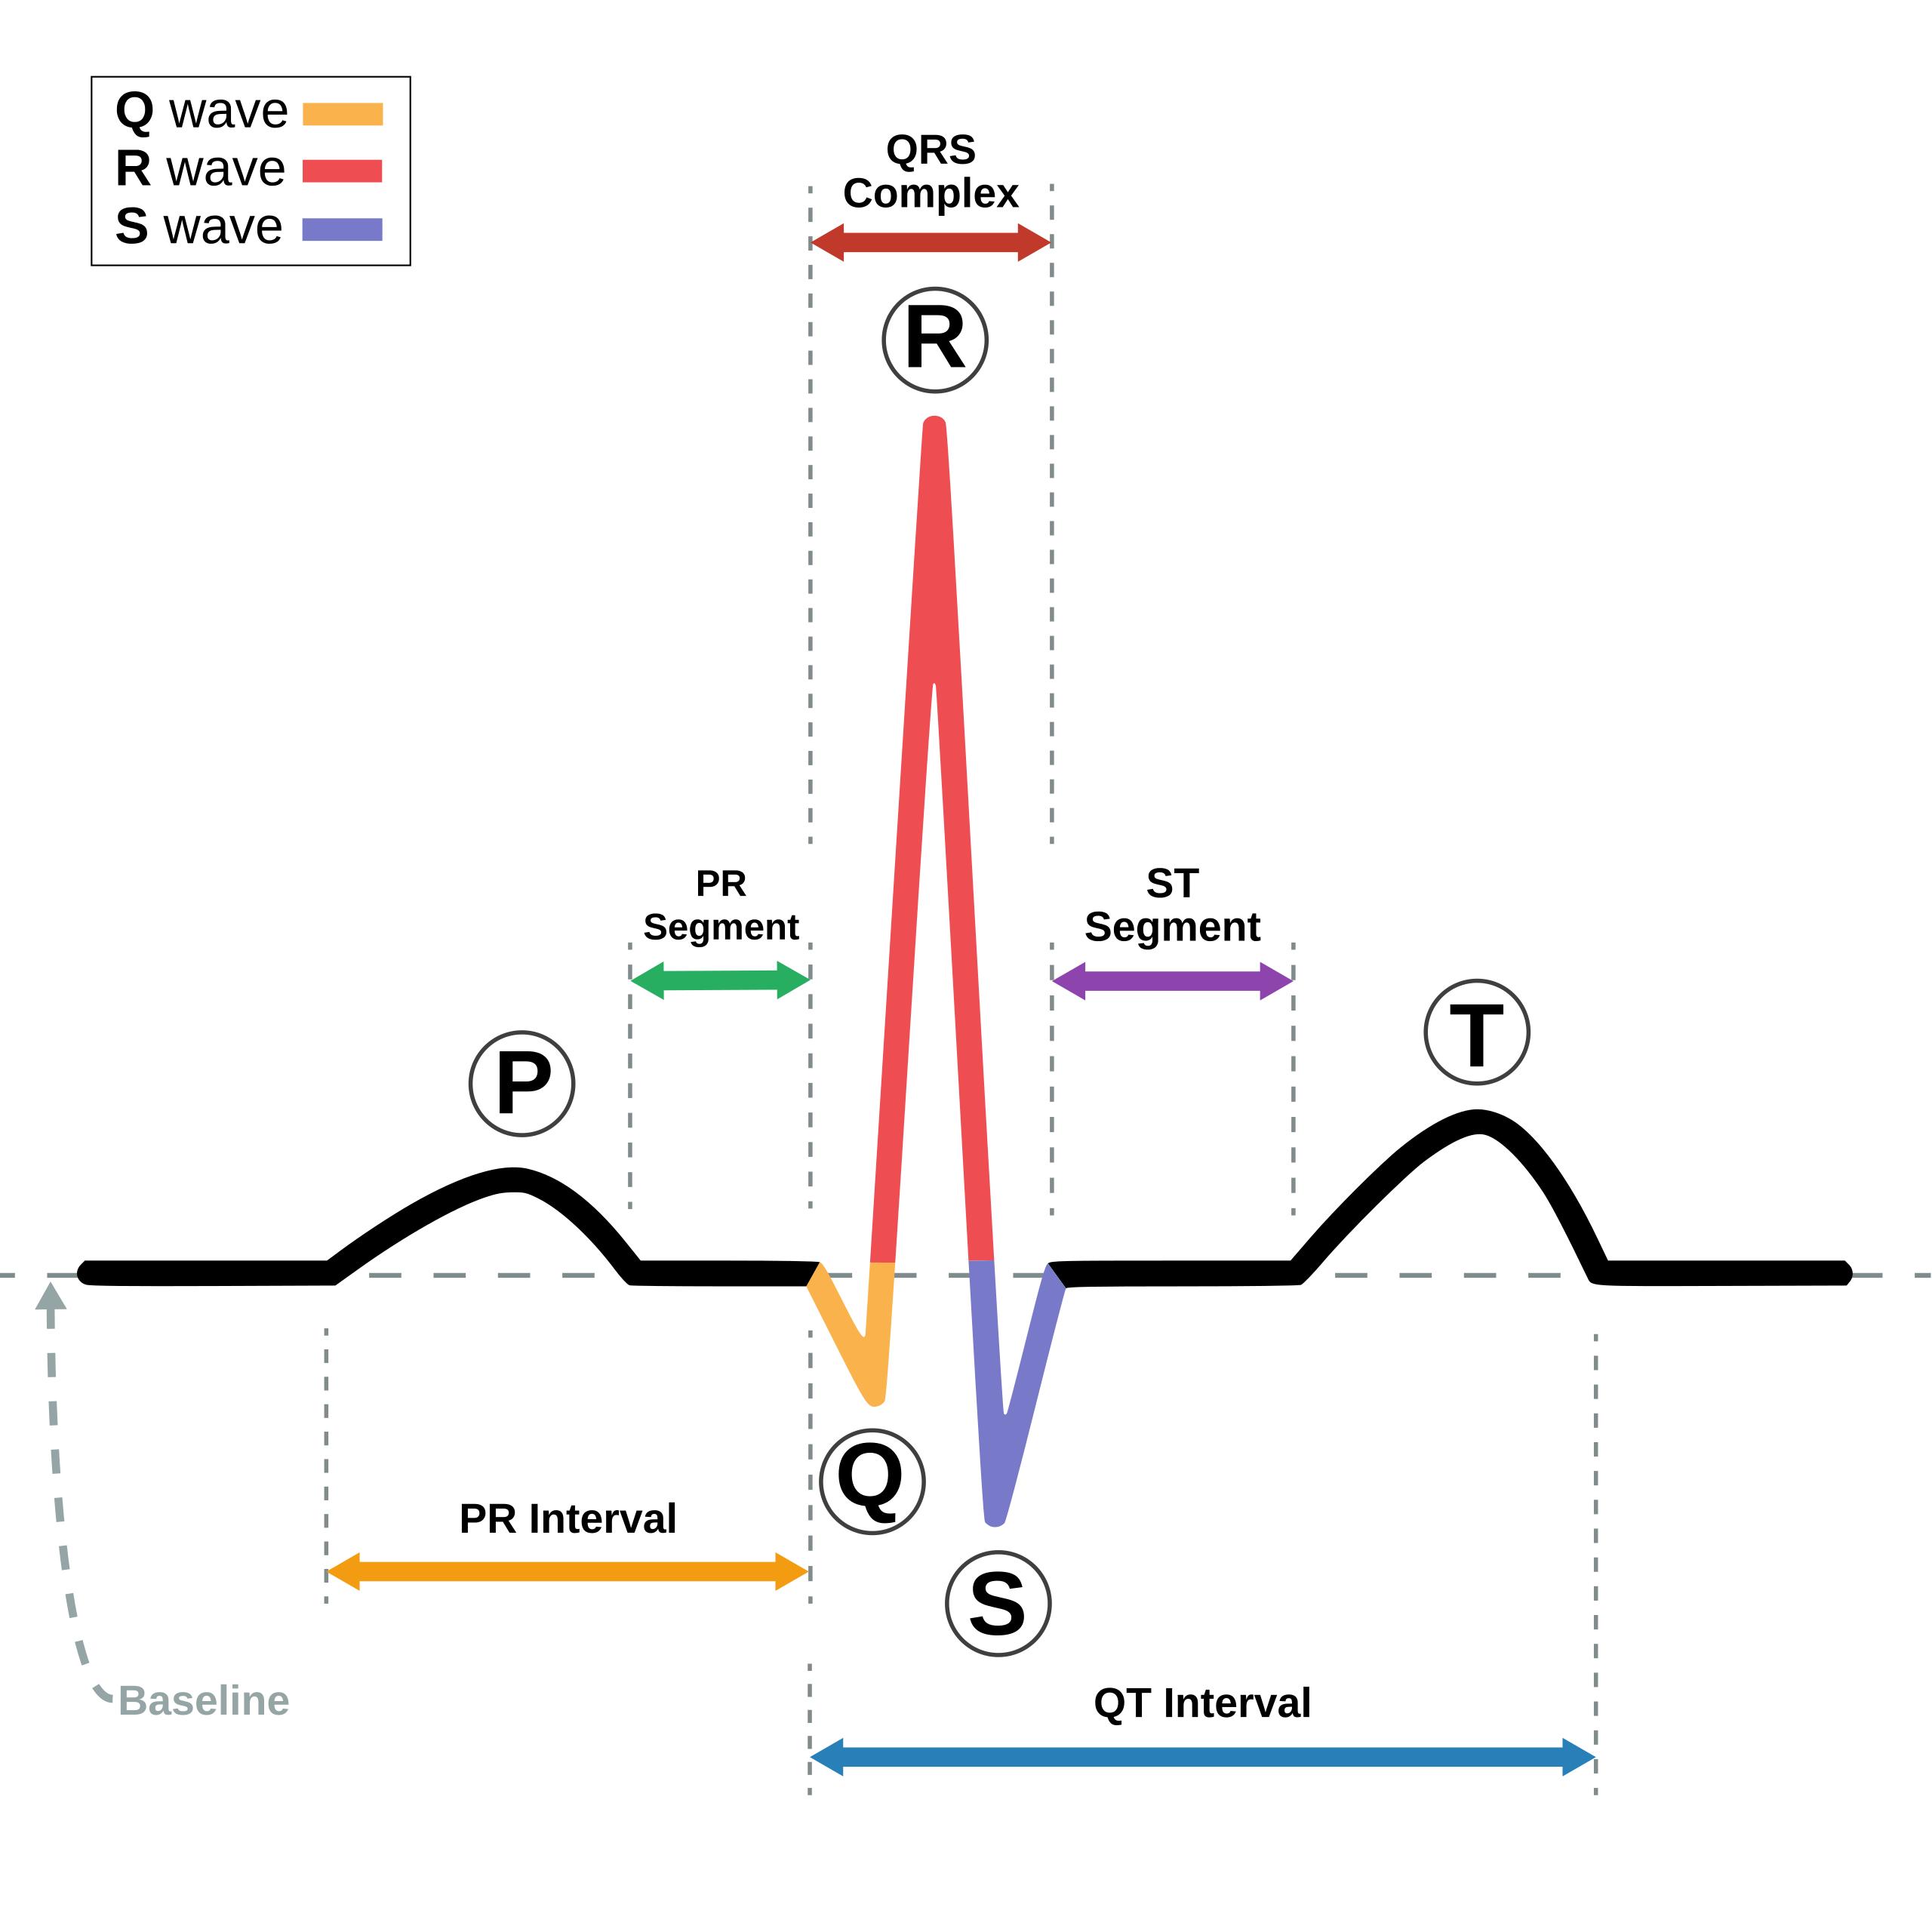
Baseline: Also known as the isoelectric line, this represents the straight line on the ECG paper when no electrical activity is being detected. It serves as the reference point for determining whether other waveforms are positive (deflecting upward) or negative (deflecting downward).
P wave: This small, rounded upward deflection represents atrial depolarization, which is the electrical trigger that causes the upper chambers of the heart (atria) to contract. It indicates that the electrical impulse has successfully originated from the sinoatrial (SA) node and is spreading across the right and left atria.
PR Segment: This is the flat, isoelectric line between the end of the P wave and the beginning of the QRS complex. Physiologically, this represents the delay of the electrical impulse at the atrioventricular (AV) node, which is necessary to allow the ventricles to fill completely with blood before they contract.
PR Interval: This measurement extends from the beginning of the P wave to the beginning of the QRS complex. It reflects the total time required for the electrical impulse to travel from the SA node, through the atria and the AV node, and down to the ventricles.
Q wave: The first negative deflection of the QRS complex, typically seen as a small dip below the baseline. It represents the depolarization of the interventricular septum, where the electrical signal moves from the left side of the septum to the right.
R wave: This is the first positive, upward deflection of the QRS complex and is usually the most prominent feature of the ECG tracing. It corresponds to the depolarization of the main mass of the ventricles, signifying the beginning of a powerful contraction.
S wave: This is the negative deflection that follows the R wave, dipping below the baseline. It represents the final depolarization of the ventricles, specifically at the base of the heart, completing the electrical activation of the lower chambers.
QRS Complex: Collectively composed of the Q, R, and S waves, this structure represents the entire process of ventricular depolarization. Because the ventricles are much larger and more muscular than the atria, this complex is significantly larger in amplitude than the P wave.
ST Segment: This flat section of the tracing connects the end of the QRS complex and the beginning of the T wave. It represents the period when the ventricles are completely depolarized and contracting to pump blood, effectively serving as the plateau phase of the cardiac action potential.
T wave: This rounded, upward deflection following the ST segment indicates ventricular repolarization. This is the physiological process where the heart muscle cells recharge and return to their resting electrical state, preparing for the next heartbeat.
QT Interval: This span measures the time from the beginning of the QRS complex to the end of the T wave. It represents the total duration of ventricular activity, encompassing both depolarization (contraction) and repolarization (relaxation).
The Physiology of the Cardiac Cycle
The human heart is an electromechanical pump, meaning that every physical contraction is preceded by an electrical stimulus. The schematic diagram provided illustrates “Normal Sinus Rhythm,” which is the standard, healthy rhythm of the heart. In this state, the electrical impulse originates in the sinoatrial (SA) node, often called the heart’s natural pacemaker. This impulse travels through a specific conduction pathway—from the atria to the AV node, down the Bundle of His, and through the Purkinje fibers—ensuring a coordinated and efficient heartbeat.
Understanding the correlation between electrical waves and mechanical action is crucial for interpreting an electrocardiogram. When the P wave appears, the atria are depolarizing; mechanically, this results in atrial systole, pushing blood into the ventricles. Following the brief delay at the PR segment, the massive spike of the QRS complex signals ventricular depolarization. This triggers ventricular systole, the forceful contraction that ejects blood into the pulmonary artery and the aorta. Finally, the T wave signifies the recovery phase, or diastole, where the heart muscle relaxes and refills with blood.
The precise timing of these intervals is vital for cardiac efficiency. Variations in the width or height of these waves can indicate specific pathologies. For example, a prolonged PR interval may suggest a heart block, where the signal is delayed too long at the AV node. Conversely, changes in the ST segment are the primary indicators of myocardial ischemia (lack of oxygen) or infarction (heart attack). Therefore, the ECG is not just a graph; it is a timeline of cellular activity.
- Key characteristics of Normal Sinus Rhythm include:
- A heart rate between 60 and 100 beats per minute.
- A regular, rhythmic spacing between R-R intervals.
- A distinct P wave preceding every QRS complex.
- A normal PR interval ranging from 0.12 to 0.20 seconds.
Cellular Mechanisms of Depolarization and Repolarization
At the cellular level, the waveforms seen on the ECG are generated by the movement of ions—specifically sodium, potassium, and calcium—across the cell membranes of cardiomyocytes. In a resting state, heart muscle cells are polarized, meaning there is a difference in electrical charge between the inside and outside of the cell. When the SA node fires, sodium channels open rapidly, allowing positive ions to rush into the cell. This shift in charge is called depolarization, and as it spreads like a wave from cell to cell, it creates the electrical current detected by skin electrodes as the P wave and QRS complex.
Following contraction, the cells must reset to fire again. This process, known as ventricular repolarization, is driven largely by the efflux of potassium ions leaving the cell. This restoration of the negative internal charge generates the T wave. Because repolarization is a slower, less synchronized process than depolarization, the T wave appears broader and more rounded than the sharp QRS spike. It is important to note that while atrial repolarization does occur, it happens simultaneously with ventricular depolarization and is usually obscured by the large QRS complex, rendering it invisible on a standard ECG.
Disruptions in this ionic exchange can lead to dangerous rhythm disturbances. For instance, a prolonged QT interval indicates that the heart is taking too long to recharge. This can be caused by genetic factors or certain medications and leaves the heart vulnerable to developing “Torsades de Pointes,” a potentially fatal form of ventricular tachycardia. Thus, analyzing the duration of these electrical phases is a critical safety measure in clinical pharmacology and patient monitoring.
Conclusion
The ECG schematic of normal sinus rhythm serves as the roadmap for cardiovascular diagnostics. By delineating the precise sequence of electrical events—from the initial atrial spark of the P wave to the ventricular recovery of the T wave—clinicians can infer the mechanical health of the heart. Recognizing the standard morphology of the P-QRS-T complex allows for the immediate identification of abnormalities, ensuring that conditions ranging from electrolyte imbalances to acute heart attacks are diagnosed and treated promptly.

