Explore the complexities of electrocardiograms, focusing on Left Bundle Branch Block (LBBB), Right Axis Deviation (RAD), and unique characteristics of post-cardiac transplant ECGs. This article provides detailed insights into these specific findings, their clinical implications, and their significance in cardiac diagnostics.
I, II, III, aVR, aVL, aVF, V1-V6: These labels represent the standard 12 leads of an electrocardiogram (ECG), which record the electrical activity of the heart from different angles. Each lead provides a unique perspective on cardiac depolarization and repolarization, allowing for a comprehensive assessment of heart function.
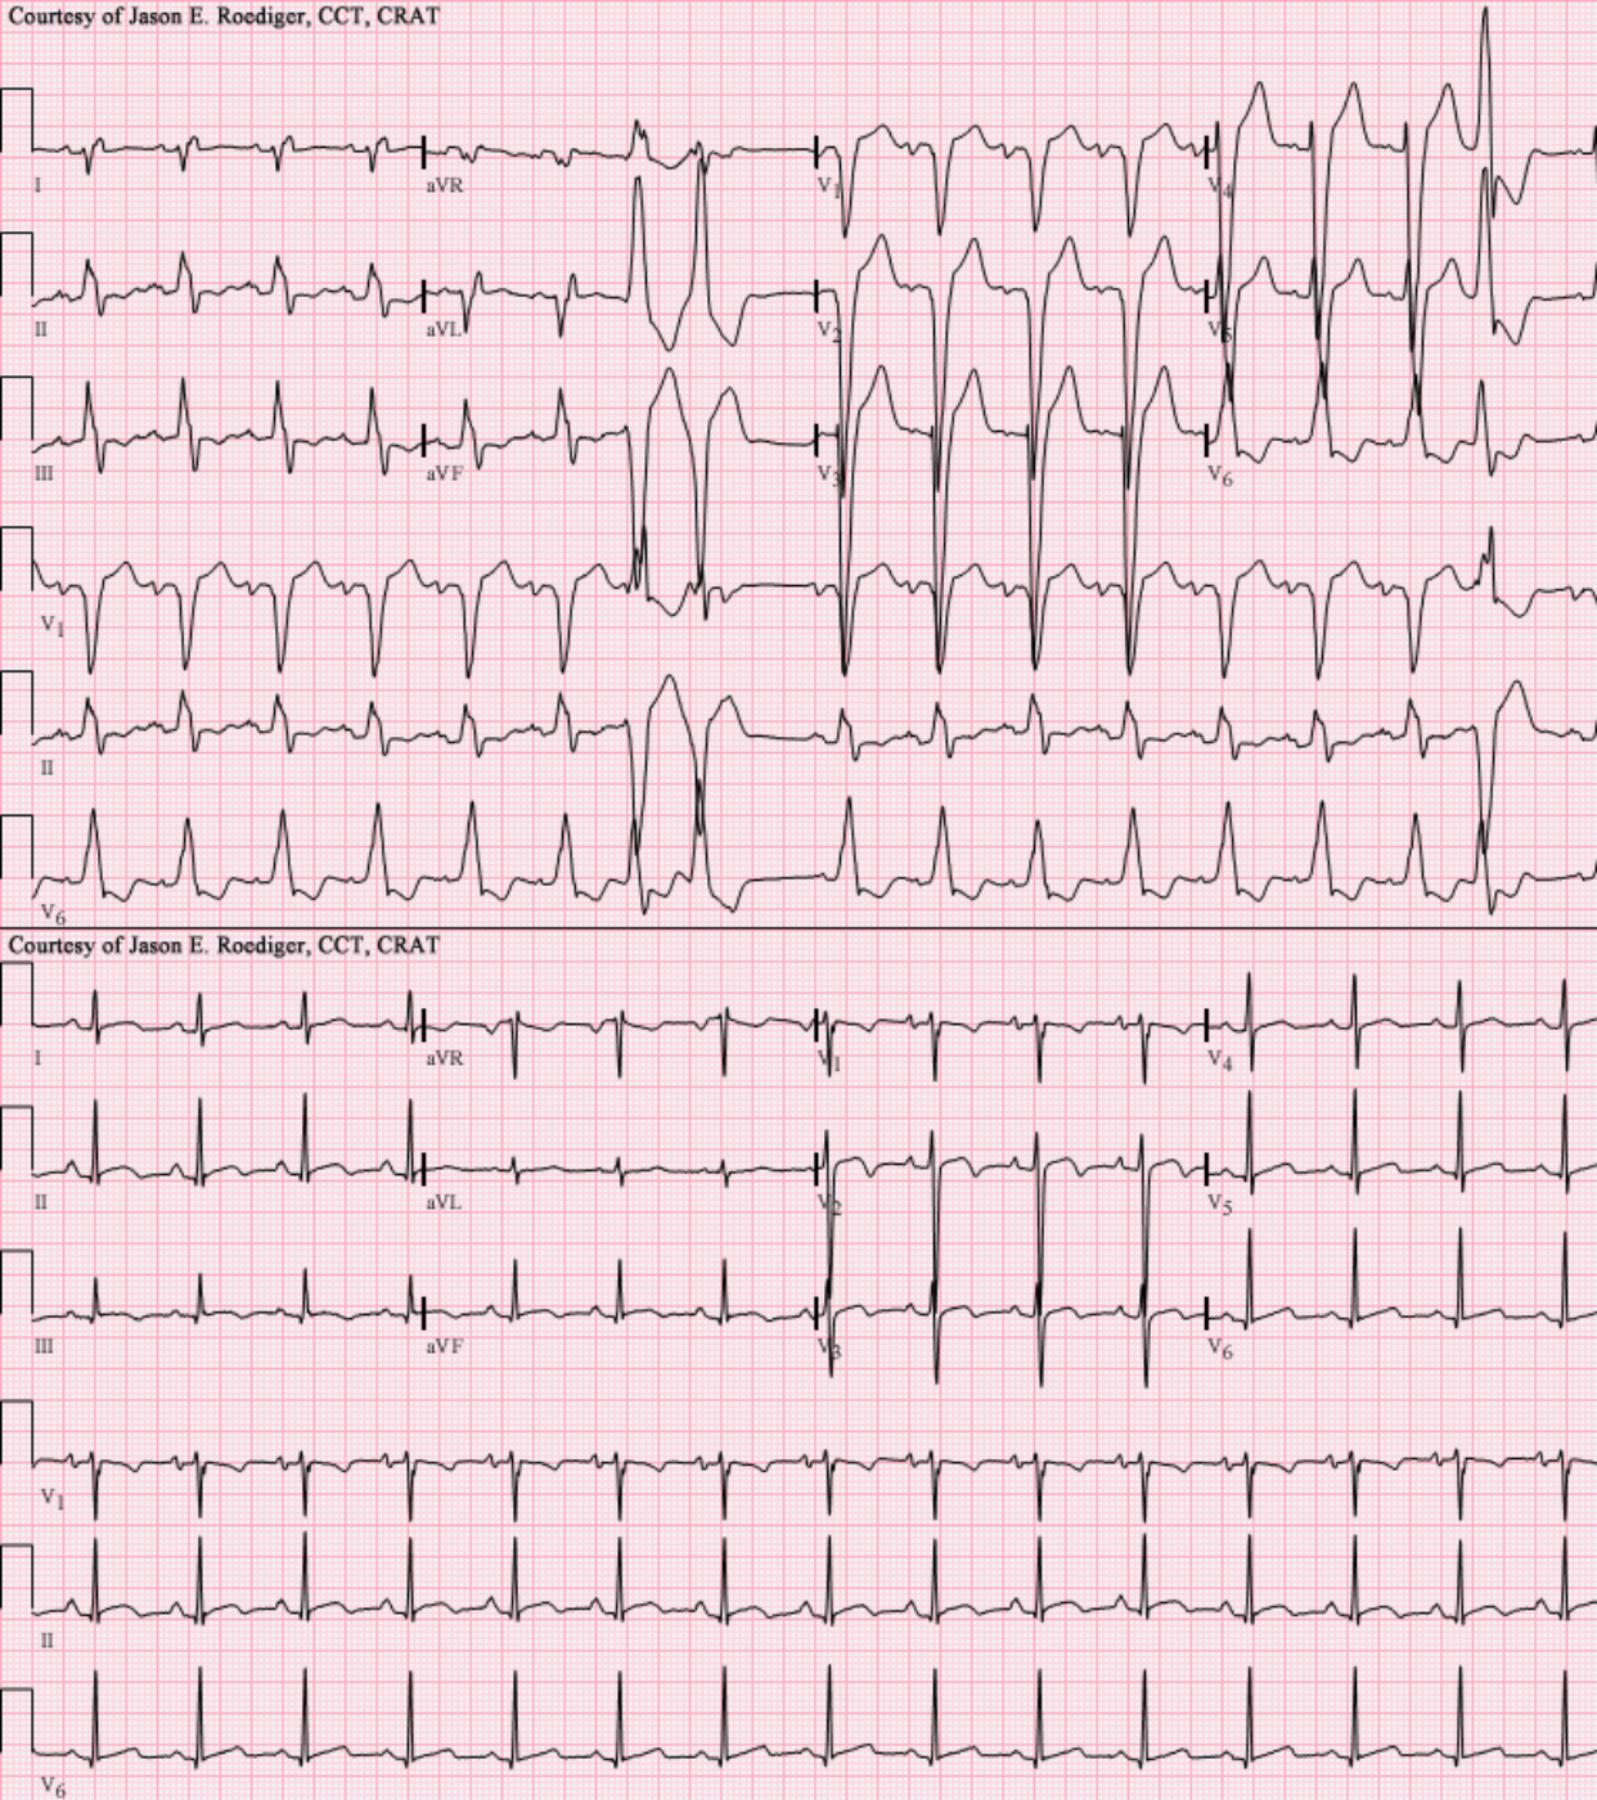
LBBB+RAD and Transplant EKG: This describes the specific clinical scenarios illustrated by the two ECG tracings: the first demonstrating Left Bundle Branch Block (LBBB) with Right Axis Deviation (RAD), and the second representing a post-cardiac transplant electrocardiogram. These are complex findings that require careful interpretation by healthcare professionals.
An electrocardiogram (ECG or EKG) is a fundamental diagnostic tool in cardiology, providing a graphical representation of the electrical activity of the heart. By placing electrodes on the skin, healthcare professionals can detect and record the tiny electrical changes that occur as the heart muscle depolarizes and repolarizes with each beat. This non-invasive test is invaluable for diagnosing a wide range of cardiac conditions, from arrhythmias and myocardial ischemia to structural heart disease and electrolyte imbalances. Interpreting an ECG requires a thorough understanding of normal cardiac electrophysiology and the various deviations that can signify pathology.
The two ECG tracings presented offer insights into specific and clinically significant findings: the first demonstrating a combination of Left Bundle Branch Block (LBBB) with Right Axis Deviation (RAD), and the second showcasing the characteristic features of a post-cardiac transplant heart. These conditions present unique electrical patterns that are crucial for diagnosis, risk stratification, and guiding patient management. Understanding the underlying pathophysiology of these findings is essential for medical professionals involved in cardiac care.
Left Bundle Branch Block (LBBB) is a conduction abnormality where the electrical impulse traveling through the heart is delayed or blocked in the left bundle branch. This significantly alters the normal sequence of ventricular depolarization, leading to characteristic wide QRS complexes (typically >120 ms) on the ECG. The QRS complex represents ventricular depolarization, and in LBBB, the left ventricle is activated late, often via muscle-to-muscle conduction from the right ventricle. This results in a prolonged and often notched or slurred QRS complex, particularly visible in the lateral leads (I, aVL, V5, V6) with broad, monophasic R waves, and deep S waves in the right precordial leads (V1, V2).
Right Axis Deviation (RAD) occurs when the main electrical vector of ventricular depolarization shifts towards the right side of the chest, typically indicating that the electrical activity is predominantly flowing downwards and to the right. On an ECG, RAD is often defined by a QRS axis between +90 and -180 degrees. This is usually determined by looking at leads I and aVF; if lead I has a predominantly negative QRS and lead aVF has a predominantly positive QRS, RAD is present. While RAD can be a normal variant in some individuals, it can also signify conditions like right ventricular hypertrophy, pulmonary embolism, or certain congenital heart defects. The combination of LBBB with RAD is a less common finding and can suggest more extensive myocardial disease or a unique conduction abnormality.
A post-cardiac transplant ECG presents unique characteristics primarily due to the denervation of the transplanted heart and the altered anatomical position. The transplanted heart is typically electrically isolated from the recipient’s autonomic nervous system, leading to a fixed heart rate that does not respond to physiological demands like exercise or stress in the same way a native heart would. Furthermore, it is common to see two sets of P waves on a post-transplant ECG: one from the recipient’s remnant sinus node (if present) and another from the donor heart’s sinus node, a phenomenon known as “double atrial activity.” Other findings might include low voltage, bundle branch blocks (including LBBB), or other arrhythmias depending on the surgical technique and donor heart’s pre-existing conditions. These features are critical for monitoring the health of the transplanted heart and detecting potential complications such as rejection or vasculopathy.
In conclusion, the interpretation of an electrocardiogram extends far beyond simply identifying a normal sinus rhythm; it involves a meticulous analysis of complex electrical patterns that provide invaluable insights into cardiac health. Conditions like Left Bundle Branch Block and Right Axis Deviation represent significant alterations in cardiac conduction and electrical activity, respectively, each with distinct clinical implications. Furthermore, the unique electrical signatures observed in a post-cardiac transplant ECG are crucial for ongoing surveillance and management of patients who have undergone this life-saving procedure. A comprehensive understanding of these ECG findings is indispensable for accurate diagnosis, effective treatment, and ultimately, improving patient outcomes in cardiovascular medicine.

