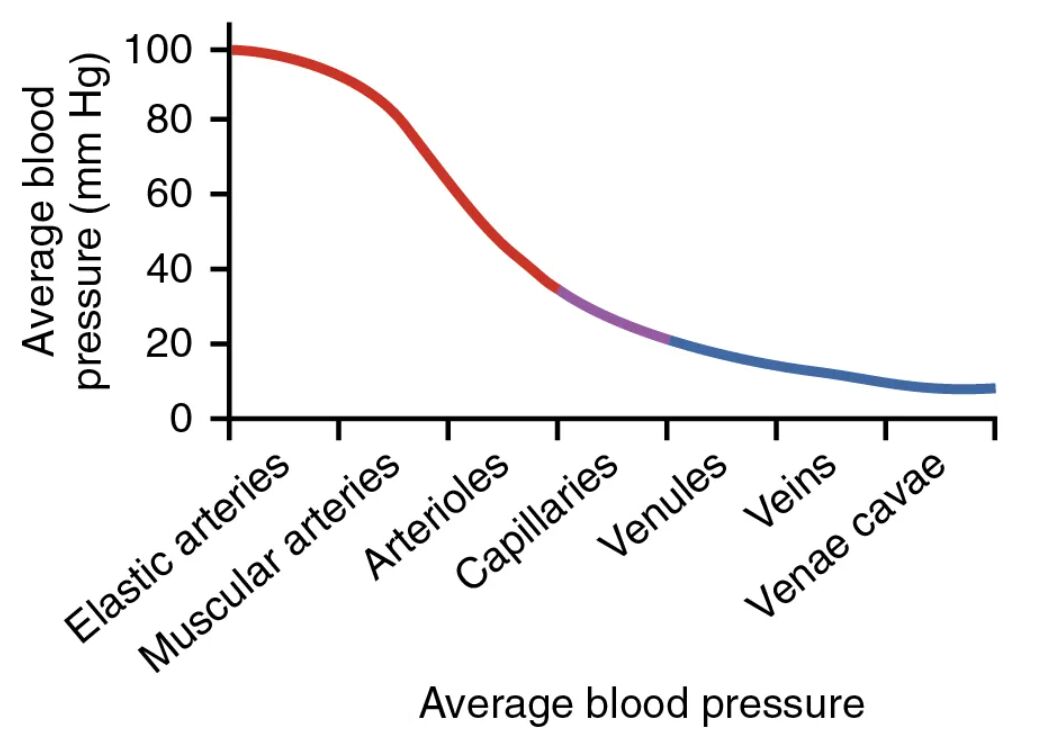
Average blood pressure is a key indicator of cardiovascular health, reflecting the force exerted by blood on vessel walls as it travels from the heart to the periphery and back. This diagram illustrates how blood pressure varies across different vessel types, from the high-pressure aorta to the low-pressure venae cavae, offering a clear view of circulatory dynamics.
Aorta Aorta exhibits an average blood pressure of approximately 100 mmHg, reflecting its role as the initial high-pressure conduit from the left ventricle. This pressure supports the rapid distribution of oxygenated blood to the systemic circulation.
Elastic arteries Elastic arteries, such as the carotid and subclavian, maintain an average blood pressure of about 90-100 mmHg. Their elastic walls absorb pulsatile flow, ensuring a steady pressure for downstream vessels.
Muscular arteries Muscular arteries, including the brachial and femoral, have an average blood pressure around 80-90 mmHg. These vessels adjust pressure through muscular contraction, directing blood to specific organs.
Arterioles Arterioles show an average blood pressure of 40-60 mmHg, serving as resistance vessels that regulate flow into capillaries. Their small size and muscular walls fine-tune pressure based on tissue needs.
Capillaries Capillaries have an average blood pressure of 20-40 mmHg, optimal for facilitating exchange between blood and tissues. This lower pressure prevents damage to their thin walls while supporting nutrient delivery.
Venules Venules exhibit an average blood pressure of 10-20 mmHg, collecting blood from capillaries with reduced pressure. This gradual decline aids the transition to the venous system.
Veins Veins maintain an average blood pressure of 5-10 mmHg, acting as capacitance vessels that store blood. Their low pressure relies on valves and muscle pumps to return blood to the heart.
Venae cavae Venae cavae have an average blood pressure near 0-5 mmHg, reflecting their role in delivering deoxygenated blood to the right atrium. This minimal pressure is sufficient for venous return under normal conditions.
Overview of Average Blood Pressure
This diagram provides a visual representation of how blood pressure decreases from the heart to the periphery and back. Each vessel type’s pressure contributes to the overall efficiency of circulation.
- Aorta starts with the highest pressure, driving systemic flow.
- Elastic arteries and muscular arteries maintain pressure while distributing blood.
- Arterioles reduce pressure, controlling entry into capillaries.
- Capillaries facilitate exchange at a lower pressure.
- Venules, veins, and venae cavae support return with progressively lower pressures.
Anatomical Role of Blood Pressure
The average blood pressure in each vessel reflects its anatomical function within the circulatory system. This gradient ensures proper blood delivery and return.
- Aorta pressure supports the initial ejection of 5 liters of blood per minute.
- Elastic arteries pressure dampens the pulse, protecting smaller vessels.
- Muscular arteries pressure adjusts to organ-specific demands, like the kidneys.
- Arterioles pressure drop is critical for regulating capillary perfusion.
- Capillaries low pressure optimizes diffusion across their thin walls.
Arterial Pressure Dynamics
Aorta, elastic arteries, and muscular arteries handle the highest pressures in the arterial system. Their role is vital for maintaining circulation.
- Aorta pressure peaks at 120 mmHg during systole, averaging 100 mmHg.
- Elastic arteries pressure stabilizes to 90-100 mmHg, aiding continuous flow.
- Muscular arteries pressure of 80-90 mmHg supports organ distribution.
- These vessels’ elasticity and muscle tone prevent pressure surges.
- The decline begins as blood moves toward arterioles.
Microcirculation and Capillary Pressure
Capillaries and arterioles form the microcirculation, where pressure is finely tuned. This adjustment supports tissue health.
- Arterioles pressure of 40-60 mmHg controls blood entry into capillaries.
- Capillaries pressure of 20-40 mmHg balances filtration and reabsorption.
- The Starling forces govern fluid movement at this level.
- Precapillary sphincters adjust arterioles pressure based on oxygen demand.
- This range prevents capillary leakage while ensuring exchange.
Venous Pressure and Return
Venules, veins, and venae cavae operate at low pressures for venous return. Their design supports efficient blood recycling.
- Venules pressure of 10-20 mmHg collects capillary outflow.
- Veins pressure of 5-10 mmHg relies on valves to prevent backflow.
- Venae cavae near 0-5 mmHg pressure is aided by thoracic suction.
- Muscle pump action boosts return despite low pressure.
- This gradient ensures blood reaches the heart without pooling.
Physical Implications of Blood Pressure
Average blood pressure influences flow velocity and resistance across vessels. These dynamics are essential for circulatory function.
- Aorta high pressure drives a velocity of 35 cm/sec.
- Elastic arteries pressure maintains 20-30 cm/sec velocity.
- Muscular arteries pressure supports organ-specific flow rates.
- Arterioles pressure reduction slows velocity to 14-21 cm/sec.
- Capillaries low pressure drops velocity to 0.3 cm/sec for exchange.
Clinical Relevance of Average Blood Pressure
Variations in average blood pressure can signal health issues or guide treatment. Monitoring these levels supports effective care.
- Elevated aorta pressure may indicate hypertension, risking aneurysm.
- Low capillaries pressure can lead to poor perfusion in shock.
- Increased veins pressure suggests venous insufficiency or heart failure.
- Arterioles pressure changes are key in diagnosing peripheral artery disease.
- Adjusting muscular arteries pressure with medication treats angina.
In conclusion, the average blood pressure diagram illustrates the critical progression from aorta to elastic arteries, muscular arteries, arterioles, capillaries, venules, veins, and venae cavae in sustaining circulation. This understanding of pressure gradients enhances appreciation for how the body maintains blood flow and tissue perfusion. It also provides a foundation for addressing cardiovascular conditions with informed strategies.

