The spatial orientation of electrocardiogram (EKG) leads is a fundamental concept in cardiology, transforming the heart’s three-dimensional electrical activity into interpretable two-dimensional waveforms. The diagram provided visualizes the intersection of the two primary systems used in a standard 12-lead ECG: the Hexaxial Reference System (derived from the limb leads) and the Horizontal Reference System (derived from the precordial leads). Understanding these vector angles is critical for clinicians to accurately determine the heart’s electrical axis, localize myocardial infarctions, and identify hypertrophy.
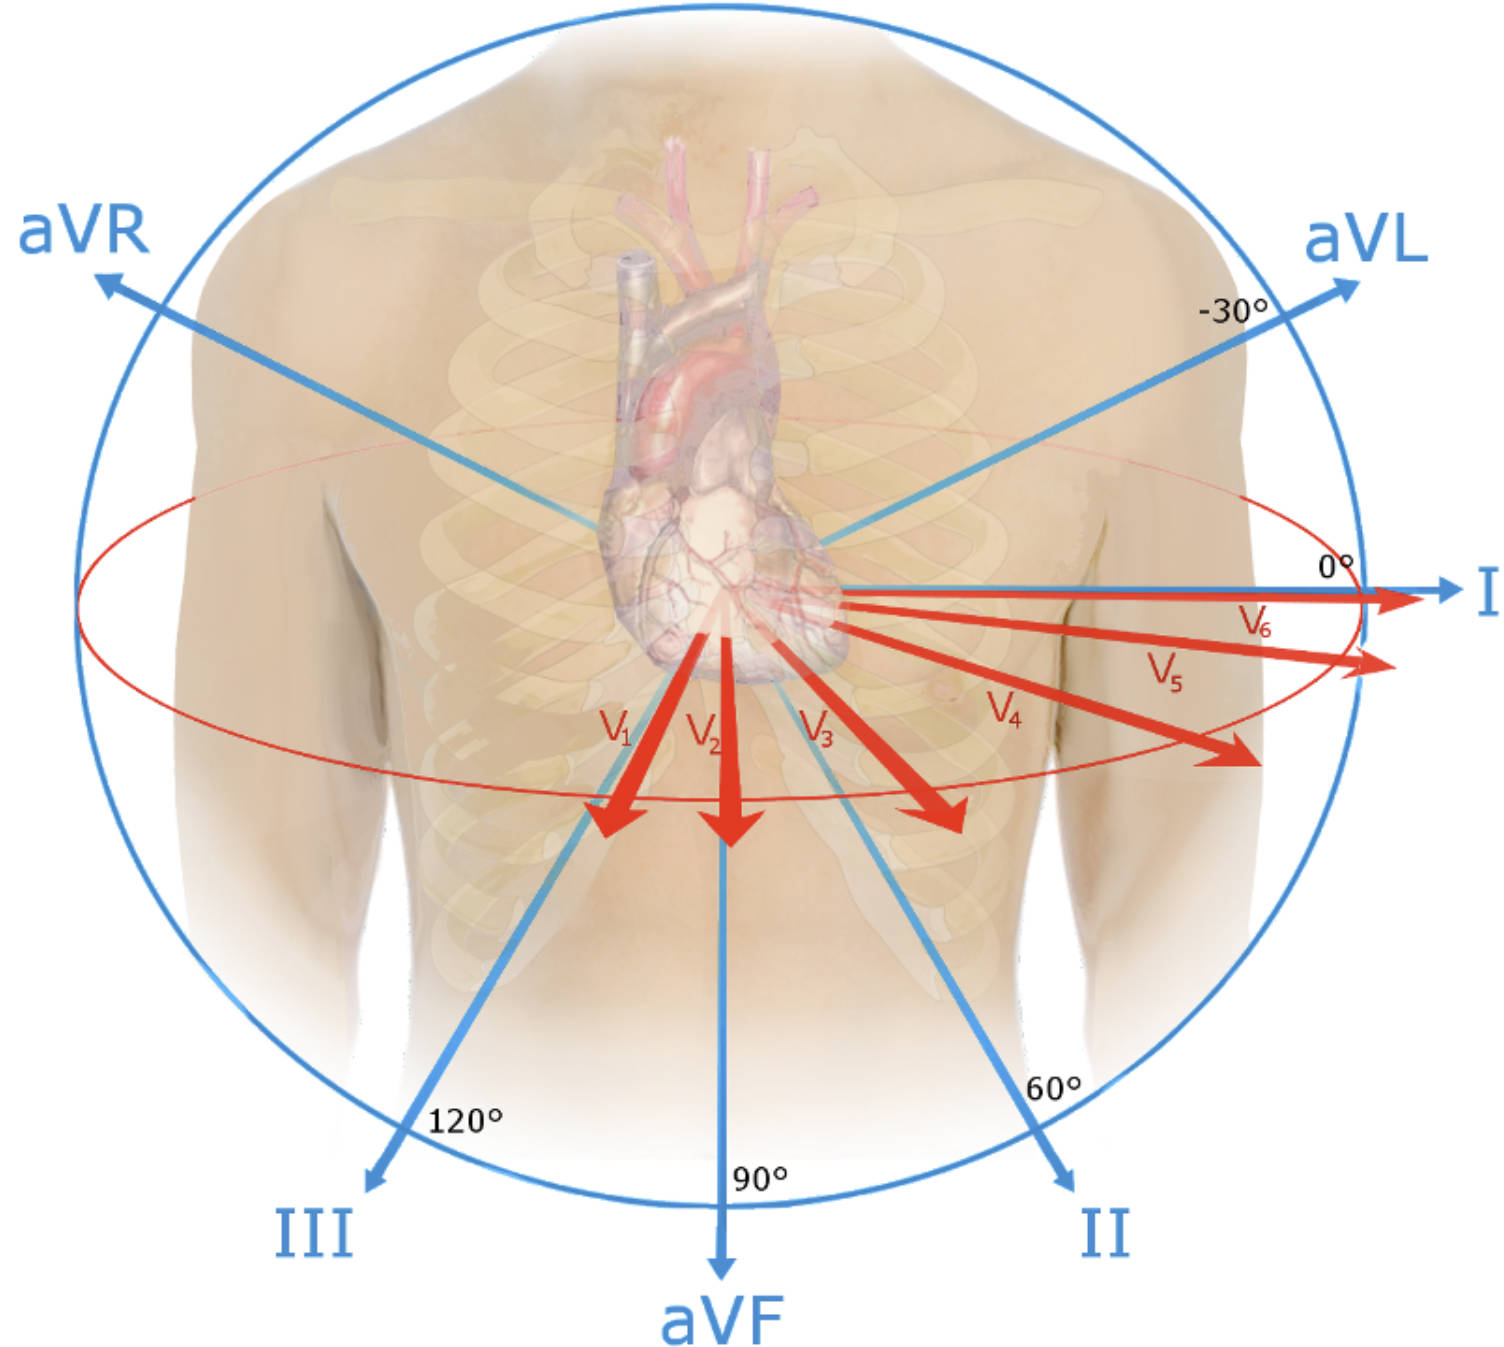
aVR: This augmented unipolar lead views the heart from the right shoulder, oriented at -150° (or 210°). Because the normal wave of depolarization moves away from the right shoulder, aVR typically presents with a negative deflection in a healthy heart.
aVL: Standing for “augmented Vector Left,” this lead is oriented at -30° and views the high lateral wall of the left ventricle. It is often paired with Lead I to assess the lateral aspect of the heart and can show signs of high lateral infarction.
aVF: This lead represents “augmented Vector Foot” and is oriented vertically at +90°, looking directly up at the inferior wall of the heart. Along with Leads II and III, it is essential for diagnosing inferior wall ischemia.
I (Lead I): Positioned at 0°, this bipolar limb lead measures the potential difference between the right and left arms. It serves as a primary reference for the lateral wall of the heart and is crucial for calculating the electrical axis.
II (Lead II): Oriented at +60°, this lead closely aligns with the normal physiological axis of the heart’s depolarization vector. Consequently, Lead II often displays the clearest and highest-voltage P-waves and QRS complexes, making it ideal for rhythm monitoring.
III (Lead III): Oriented at +120°, this bipolar lead views the inferior surface of the heart from the right lower perspective. It works in triangulation with Lead II and aVF to provide a complete picture of the inferior myocardial wall.
V1: This precordial lead is located in the fourth intercostal space at the right sternal border. It provides a direct view of the right ventricle and is instrumental in detecting right ventricular hypertrophy and posterior changes (reciprocal changes).
V2: Positioned in the fourth intercostal space at the left sternal border, V2 views the ventricular septum. Together with V1, it is a primary lead for identifying septal infarcts and bundle branch blocks.
V3: Located midway between V2 and V4, this lead sits over the anterior surface of the interventricular septum and the anterior wall of the left ventricle. It represents the transition zone where the QRS complex typically changes from negative to positive polarity.
V4: Placed in the fifth intercostal space at the midclavicular line, V4 looks directly at the apex of the left ventricle. This lead is highly sensitive for detecting apical anterior issues and is a key marker for anterior wall myocardial infarction.
V5: Positioned at the same horizontal level as V4 but at the anterior axillary line, V5 views the low lateral wall of the left ventricle. It captures the massive depolarization forces of the left ventricle, often showing tall R-waves.
V6: Located at the midaxillary line at the same level as V4 and V5, this lead provides a lateral view of the left ventricle. It complements Leads I and aVL in assessing lateral wall pathology and left ventricular hypertrophy.
The Physics and Physiology of Cardiac Vectors
To fully interpret an electrocardiogram, one must view the heart as a central electrical generator situated within a volume conductor (the human torso). The image combines two distinct planes to create a 360-degree perspective. The blue circle and lines represent the Hexaxial Reference System, which covers the frontal plane (up, down, left, right). This system is essential for determining the cardiac electrical axis—the average direction of the wave of depolarization as it spreads through the ventricles. If the axis shifts beyond -30° or +90°, it may indicate pathology such as conduction defects (hemiblocks) or ventricular enlargement.
The red arrows represent the horizontal plane, created by the precordial leads (V1–V6). While the limb leads look at the heart like a clock face on a flat wall, the precordial leads wrap around the chest, slicing through the body horizontally. This allows the clinician to see the heart from front to back (anteroposteriorly). This “Z-axis” information is vital because the heart is a three-dimensional organ; a problem on the posterior wall or the septum might be invisible if we only relied on the frontal plane leads. The combination of these orthogonal views ensures that no “blind spots” remain on the ventricular myocardium.
The clinical utility of understanding these spatial orientations cannot be overstated. By knowing exactly which angle each lead “looks” from, a physician can pinpoint the location of damaged tissue during a heart attack. For example, if the precordial leads V1 through V4 show ST-segment elevation, the damage is located in the anteroseptal wall, likely due to a blockage in the Left Anterior Descending (LAD) artery. Conversely, changes in the “inferior leads” (II, III, aVF) point toward the Right Coronary Artery (RCA).
Key clinical applications of this spatial orientation include:
- Axis Determination: Calculating whether the heart’s electrical forces are deviated left, right, or indeterminate.
- Infarct Localization: Correlating specific leads to specific coronary artery distributions (e.g., Lateral leads I, aVL, V5, V6 correspond to the Circumflex artery).
- Chamber Hypertrophy: Identifying enlarged heart chambers by observing increased voltage in leads oriented toward the hypertrophied muscle.
- Differentiation of Arrhythmias: Using vector analysis to determine the origin of ventricular tachycardia (e.g., outflow tract vs. apex).
Electrical Activity and Vector Analysis
The concept of a “vector” is central to understanding why EKG waves look the way they do. A vector represents both the magnitude (strength) and direction of the electrical force. In the image, the length of the arrows suggests the direction the leads are monitoring. Physiologically, when the sinoatrial (SA) node fires, the depolarization wave spreads through the atria and then down into the massive ventricular muscle. Since the left ventricle is much thicker than the right, the net electrical axis typically points downward and to the left (between 0° and +90°).
This explains why Lead II usually has the most positive deflection: the electrical current is heading almost directly toward the Lead II positive pole. Conversely, aVR looks from the opposite shoulder; the current runs away from it, causing a downward (negative) deflection. Understanding these normal spatial relationships allows medical professionals to instantly recognize when a tracing is abnormal. For instance, a positive QRS in aVR is highly specific for lead reversal or severe right axis deviation. Mastery of these spatial orientations moves the practitioner from simple pattern recognition to advanced physiological understanding.
In conclusion, the spatial orientation of EKG leads provides the geometric framework necessary for advanced cardiac diagnostics. By superimposing the frontal hexaxial system with the horizontal precordial system, the standard 12-lead ECG offers a comprehensive 3D view of cardiac physiology. Whether calculating the mean electrical axis or localizing an acute infarction, the ability to visualize these vectors relative to the anatomical position of the heart is a critical skill for accurate medical interpretation.

