Explore the subtle yet critical electrocardiogram (ECG) features of Brugada Syndrome Type 2, a complex channelopathy with a risk of sudden cardiac death. This article delves into the characteristic “saddle-back” ST elevation, its differentiation from other conditions, and the diagnostic role of sodium channel blocking drugs.
I, II, III, aVR, aVL, aVF, V1, V2, V3, V4, V5, V6: These labels denote the standard 12 leads of an electrocardiogram (ECG), each providing a distinct electrical view of the heart. The consistent grid allows for precise measurement of electrical activity, essential for identifying subtle abnormalities.
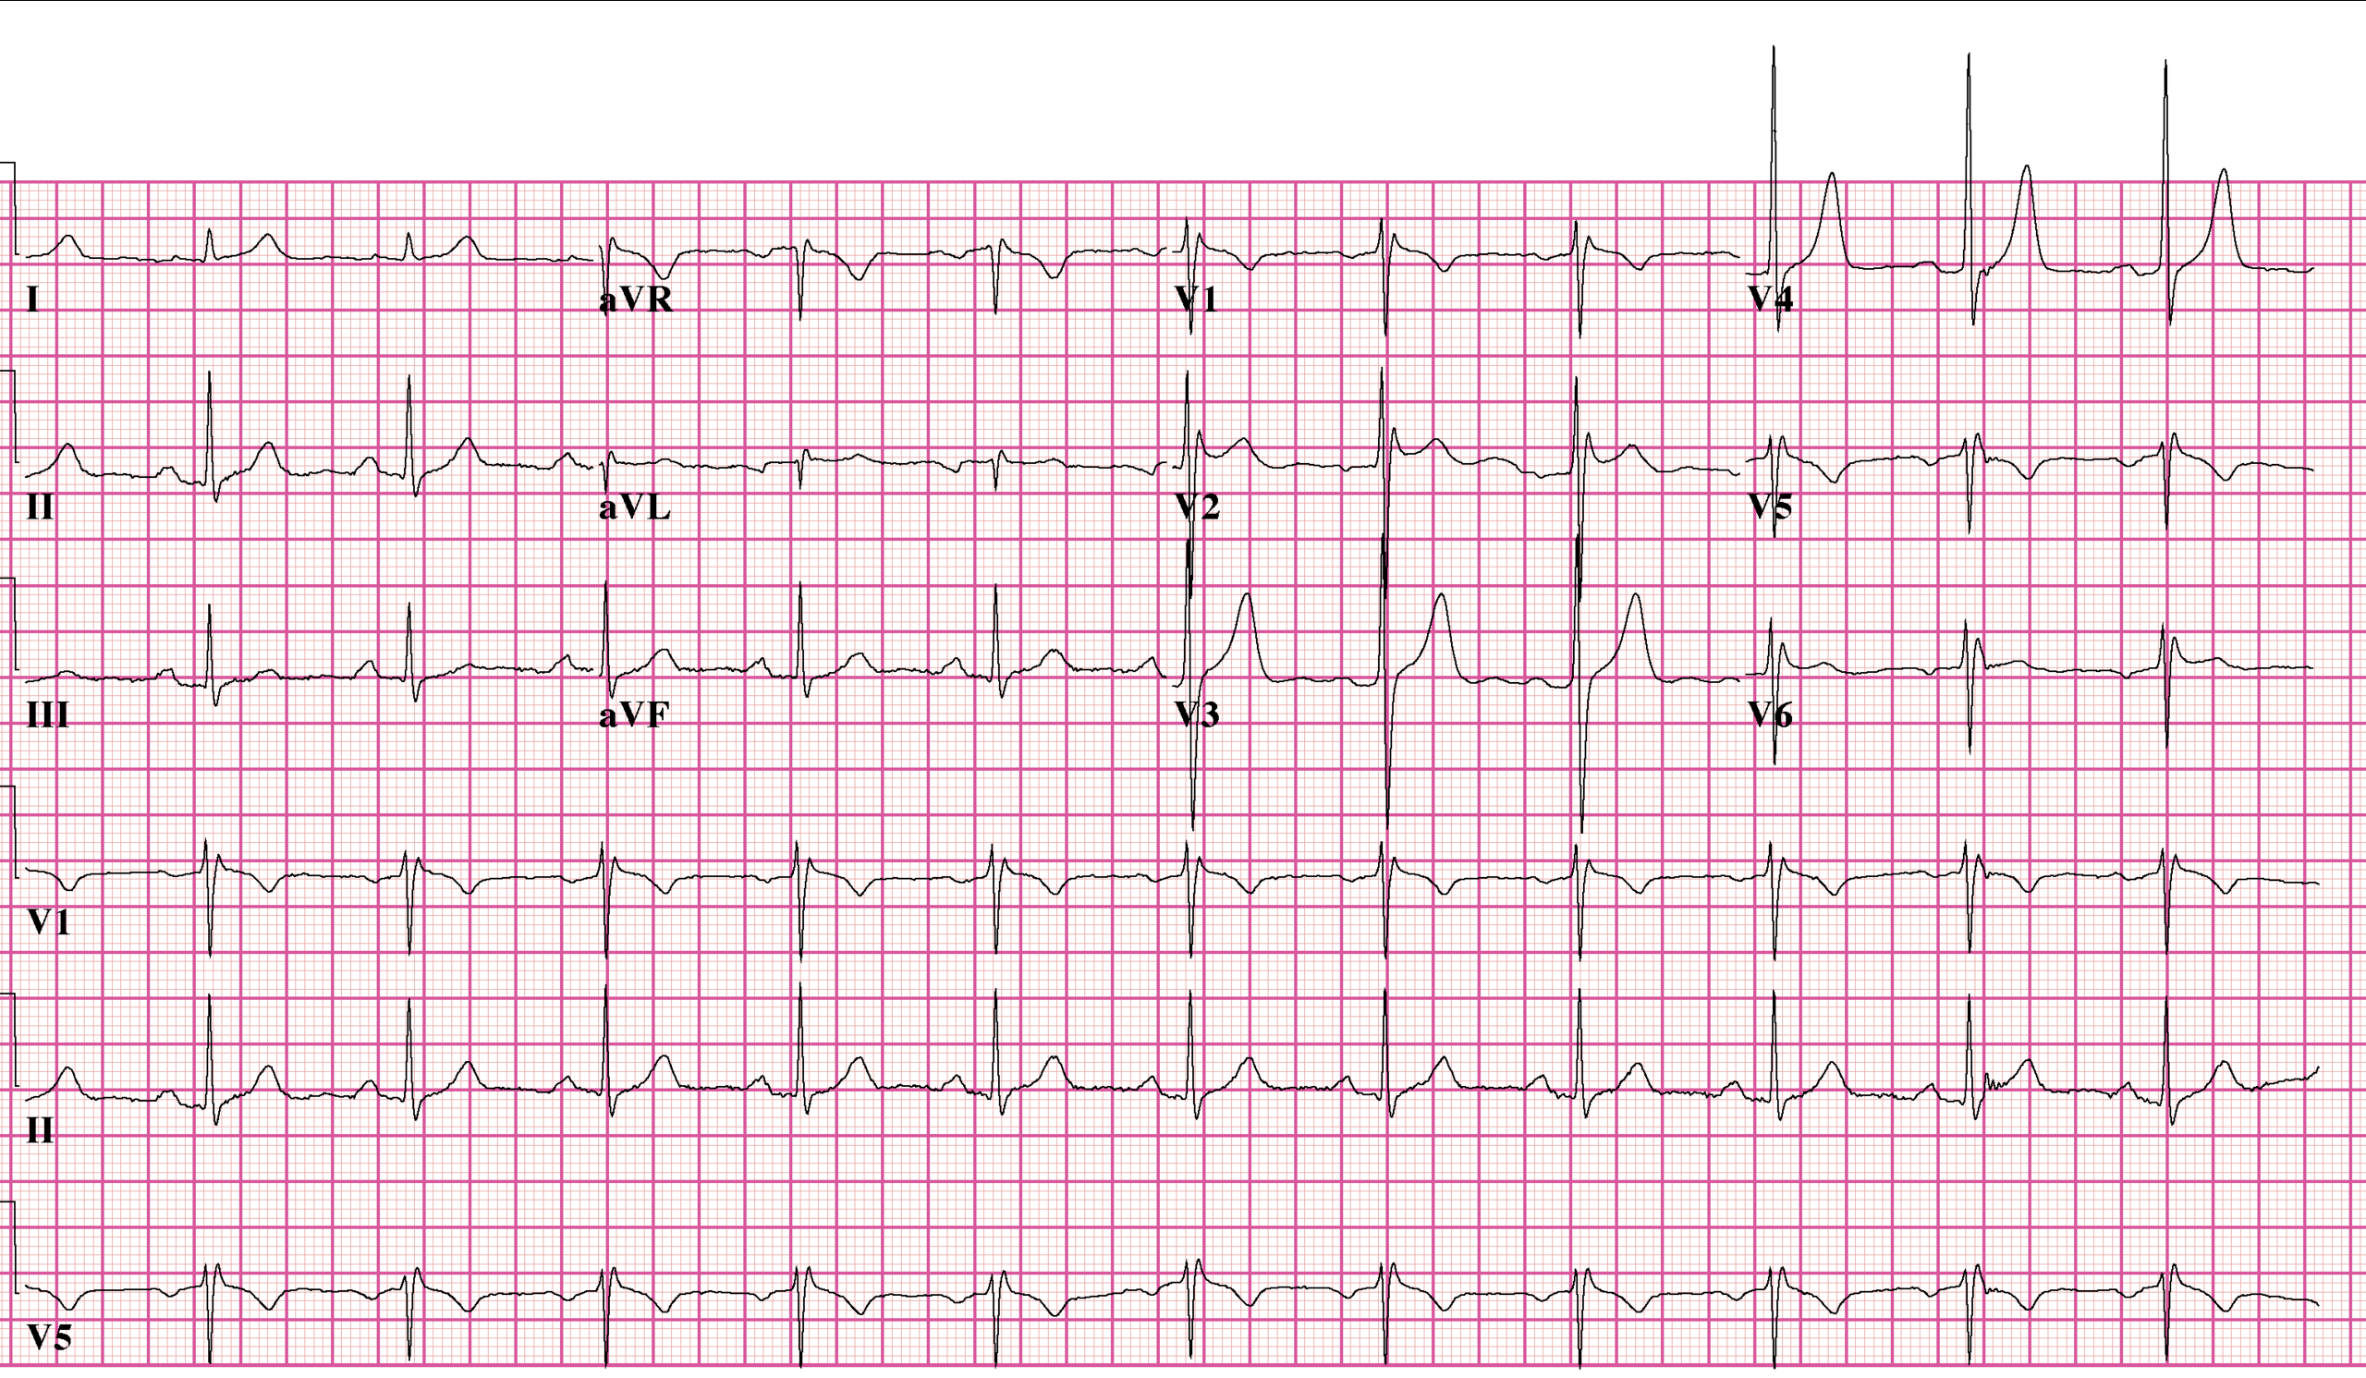
Brugada syndrome type2 EKG: This image presents an electrocardiogram tracing that exhibits features suggestive of Brugada Syndrome Type 2. This specific pattern, while not a definitive Type 1, alerts clinicians to a potential underlying cardiac channelopathy.
An electrocardiogram (ECG or EKG) is an indispensable diagnostic tool in cardiology, providing a non-invasive graphical representation of the heart’s electrical activity. By recording the tiny electrical impulses generated during each heartbeat, the ECG offers critical insights into the heart’s rhythm, conduction system, and the presence of various cardiac pathologies. Among these, Brugada Syndrome is a distinct and potentially life-threatening inherited cardiac channelopathy that often manifests with characteristic, albeit sometimes subtle, ECG patterns. Recognizing these patterns is paramount for timely diagnosis and appropriate risk stratification.
Brugada Syndrome is a genetic disorder characterized by specific ECG abnormalities and an increased risk of sudden cardiac death due to polymorphic ventricular tachycardia or ventricular fibrillation. It is primarily caused by mutations in genes encoding cardiac sodium channels, leading to ion channel dysfunction. The syndrome is often diagnosed in individuals who have experienced syncope, nocturnal agonal respiration, or have a family history of sudden cardiac death. The ECG patterns associated with Brugada Syndrome are crucial for diagnosis, but they can be intermittent or concealed, making diagnosis challenging.
The provided ECG tracing demonstrates features consistent with Brugada Syndrome Type 2, characterized by a “saddle-back” pattern of ST elevation in the right precordial leads (V1-V2). This particular morphology, while suggestive, is often insufficient for a definitive diagnosis without further provocation or specific clinical context. This highlights the diagnostic complexities inherent in Brugada Syndrome, necessitating a comprehensive approach that includes clinical evaluation and, at times, pharmacological challenge.
- Brugada Syndrome is a genetic channelopathy with characteristic ECG patterns.
- It carries a risk of sudden cardiac death from ventricular arrhythmias.
- Type 2 Brugada pattern shows a “saddle-back” ST elevation in V1-V2.
- Pharmacological challenge can unmask the definitive Type 1 pattern.
The ECG in the image shows an RSR’ pattern in leads V1 and V2, which could initially be interpreted as an incomplete or complete right bundle branch block (RBBB). However, the critical feature suggesting Brugada Syndrome is the associated ST elevation in these leads, particularly prominent in V2. This ST elevation in Type 2 Brugada Syndrome is described as a “saddle-back” morphology: the ST segment typically has a high takeoff, descends to a minimum of 0.5 mm above the baseline, and then rises to a positive or biphasic T wave. This differs from the definitive Type 1 Brugada pattern, which exhibits a coved-type ST elevation of at least 2 mm in V1-V2 (or V3) followed by a negative T wave.
The information accompanying the image mentions that this patient received sodium channel blocking drugs to acquire a Type 1 morphology and confirm the diagnosis. This pharmacological challenge is a key diagnostic procedure for Brugada Syndrome, especially when the baseline ECG shows a Type 2 pattern or is non-diagnostic. Drugs such as procainamide, flecainide, or ajmaline can unmask the characteristic coved-type ST elevation (Type 1 pattern) in the right precordial leads by further impairing sodium channel function, thereby revealing the underlying ion channel abnormality. This provocation test is conducted under strict monitoring due to the risk of inducing arrhythmias.
It is also noted that V5 and V6 are placed one intercostal space above V1 and V2 (V1 IC3 and V2 IC3). High placement of precordial leads (usually in the 2nd or 3rd intercostal space) is often performed when Brugada Syndrome is suspected, as it can sometimes unmask or enhance the characteristic ST elevation, particularly in cases where standard lead placement does not reveal the pattern. This technical adjustment is an important consideration in the diagnostic workup for this condition. The differential diagnosis for the Type 2 pattern includes RBBB, early repolarization, and other conditions causing ST elevation, underscoring the need for careful interpretation and, often, expert cardiology consultation.
In conclusion, the ECG features suggestive of Brugada Syndrome Type 2, particularly the “saddle-back” ST elevation in leads V1 and V2, represent a crucial indicator of a potentially life-threatening cardiac channelopathy. While this pattern may initially resemble a Right Bundle Branch Block, the presence of characteristic ST elevation necessitates a thorough investigation. The use of sodium channel blocking drugs to unmask a definitive Type 1 morphology, coupled with careful lead placement, forms an essential part of the diagnostic protocol. Early and accurate diagnosis of Brugada Syndrome is paramount for risk stratification and implementing preventive measures, such as an implantable cardioverter-defibrillator (ICD), to avert sudden cardiac death.

