The immune system’s ability to respond to pathogens is a remarkable process, with antibody responses playing a central role in protecting the body from infection. This graph illustrates how antibody levels change over time following initial and subsequent exposures to an antigen, showcasing the difference between primary and secondary immune reactions. Understanding these responses provides insight into the body’s adaptive defenses and the science behind vaccination efficacy, making it a key area of study for grasping immunological principles.
Key Labels in the Antibody Response Graph
This section outlines each labeled component in the image, offering a clear understanding of the immune response timeline.
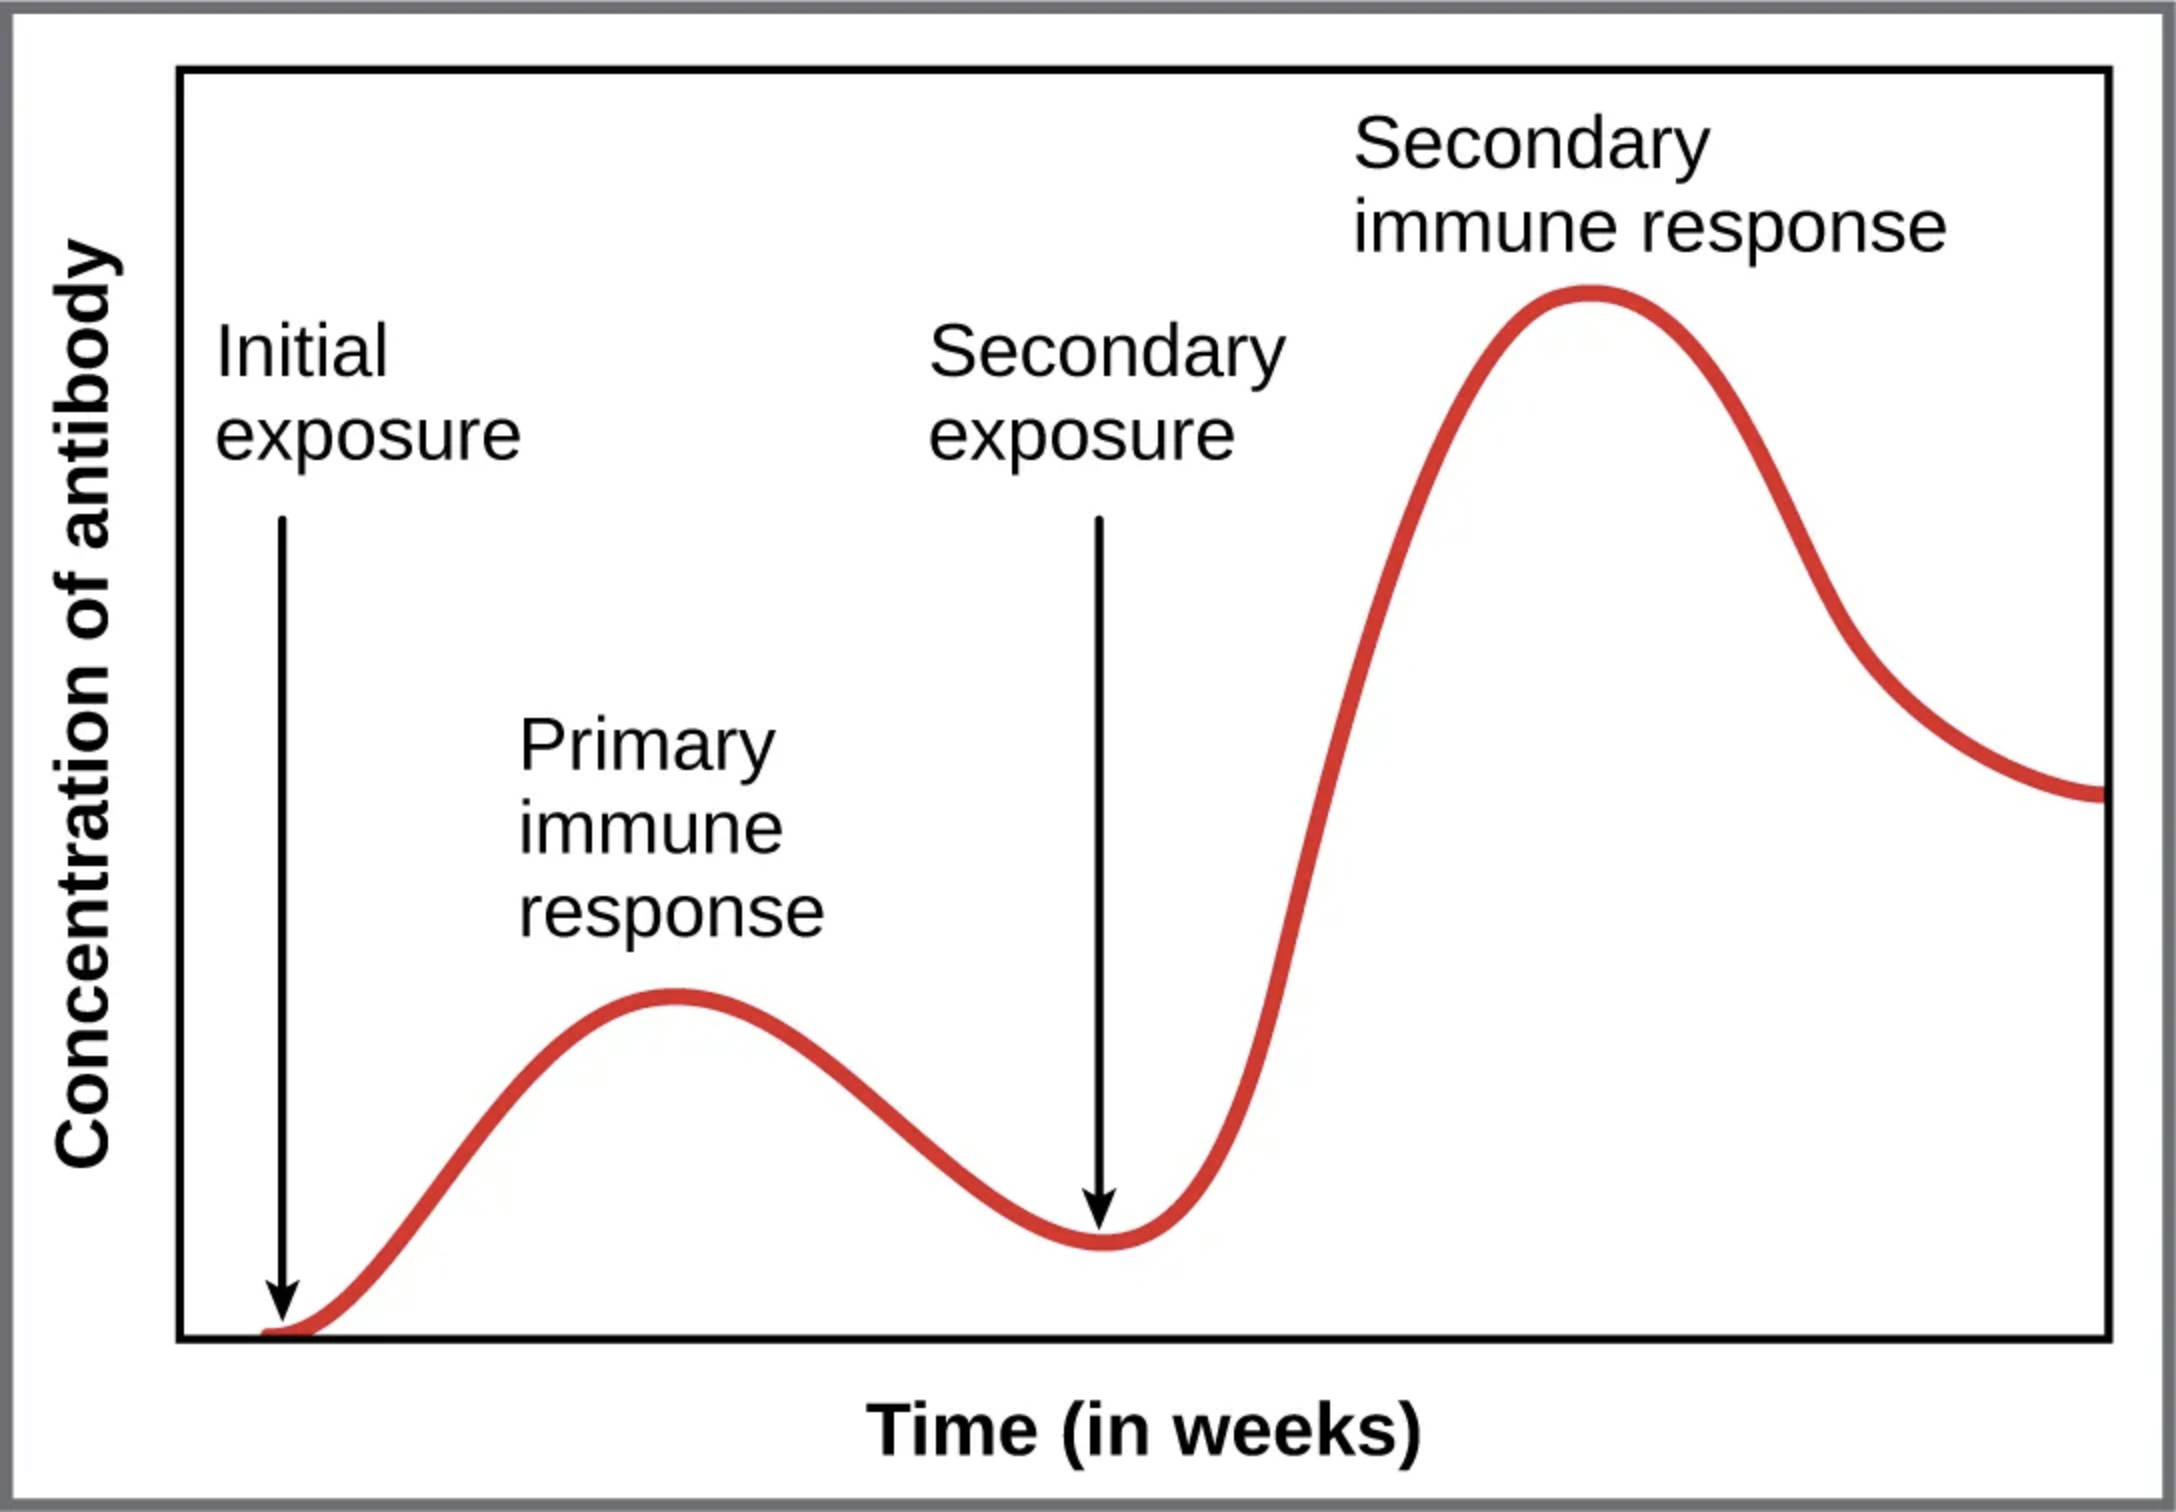
Concentration of antibody: This axis measures the level of antibodies in the blood, indicating the strength of the immune response over time. Higher concentrations reflect increased antibody production by plasma cells, which is critical for neutralizing pathogens.
Initial exposure: This marks the first encounter with a specific antigen, such as Antigen A, triggering the primary immune response. It sets the stage for the immune system to recognize and begin combating the invader, initiating a slower but foundational reaction.
Primary immune response: This phase shows the initial rise and fall of antibody levels after the first exposure, typically peaking within weeks. It involves the activation of naive B cells, leading to the production of antibodies, primarily IgM, followed by a decline as the threat is managed.
Secondary exposure: This indicates a second encounter with the same antigen, prompting a faster and more robust response due to memory B cells. It highlights the immune system’s ability to recall previous encounters, enhancing protection against recurring infections.
Secondary immune response: This phase depicts a sharp increase in antibody levels, peaking higher and faster than the primary response, due to memory cell activation. It results in the production of higher-affinity antibodies, such as IgG, offering more effective and sustained immunity.
Time (in weeks): This axis tracks the duration over which the immune response unfolds, providing a temporal context for antibody concentration changes. It allows observation of the lag in the primary response versus the rapid escalation in the secondary response.
The Science Behind Primary and Secondary Antibody Responses
The immune system’s adaptive nature shines through in its handling of antigen exposure. This process involves distinct phases that build a tailored defense.
- The primary immune response begins when a novel antigen, like Antigen A, binds to B cell receptors.
- Naive B cells proliferate and differentiate into plasma cells, secreting initial antibodies over several weeks.
- Antibody levels rise gradually, peaking before declining as memory B cells form for future protection.
- This response is slower and produces lower antibody titers, reflecting the time needed to activate and expand the immune response.
- IgM is the predominant antibody class initially, with a switch to IgG occurring as the response matures.
Understanding the Secondary Immune Response
A second exposure to the same antigen triggers a more efficient reaction. Memory cells ensure a quicker and stronger defense mechanism.
- The secondary immune response activates memory B cells, leading to rapid proliferation within days.
- Plasma cells produce higher levels of antibodies, with a peak concentration surpassing the primary response.
- This phase features class-switched antibodies, such as IgG, which offer improved affinity and longevity.
- The response subsides faster once the antigen is neutralized, thanks to the pre-existing immune memory.
- This mechanism underpins the success of vaccines, which prime the system for future pathogen encounters.
Physiological Implications of Antibody Dynamics
The interplay between primary and secondary responses has significant implications for immunity. It reflects the body’s ability to adapt and refine its defenses over time.
- Memory B cells and long-lived plasma cells in the bone marrow sustain antibody levels post-response.
- Cytokines and T cell help enhance B cell differentiation, boosting antibody production efficiency.
- The shift from IgM to IgG during secondary responses improves pathogen neutralization and complement activation.
- This adaptive process can be influenced by factors like antigen dose and the individual’s immune health.
- Understanding these dynamics aids in developing therapies, such as immunoglobulin treatments, for immune deficiencies.
Clinical Relevance and Vaccination Insights
The graph’s depiction of antibody responses offers valuable lessons for clinical practice. It underscores the importance of immunization strategies in building lasting immunity.
- Vaccines mimic initial exposure, eliciting a primary response to generate memory cells without causing disease.
- A booster dose triggers the secondary response, ensuring high antibody levels for prolonged protection.
- This approach is critical for diseases like measles, where sustained immunity prevents outbreaks.
- Monitoring antibody concentration over time helps assess vaccine efficacy and immune status.
- The process also informs the timing of booster shots to maintain optimal protection levels.
In conclusion, the graph of primary and secondary antibody responses illustrates the immune system’s sophisticated ability to learn and adapt. By generating memory cells during the initial encounter, the body ensures a rapid and potent defense against future exposures, a principle that drives modern immunology and vaccination strategies. This dynamic process highlights the elegance of adaptive immunity, offering a foundation for ongoing health protection.

