The electrocardiogram (ECG or EKG) remains one of the most essential diagnostic tools in modern medicine, providing a window into the electrical activity of the heart. Central to this diagnostic capability is the accurate placement of electrodes, specifically the limb leads, which form the foundation of the standard 12-lead tracking system. This article details the anatomical positioning and physiological function of the four primary limb electrodes—Right Arm, Left Arm, Right Leg, and Left Leg—explaining how they interact to create Einthoven’s Triangle and generate the vectors necessary for cardiac analysis.
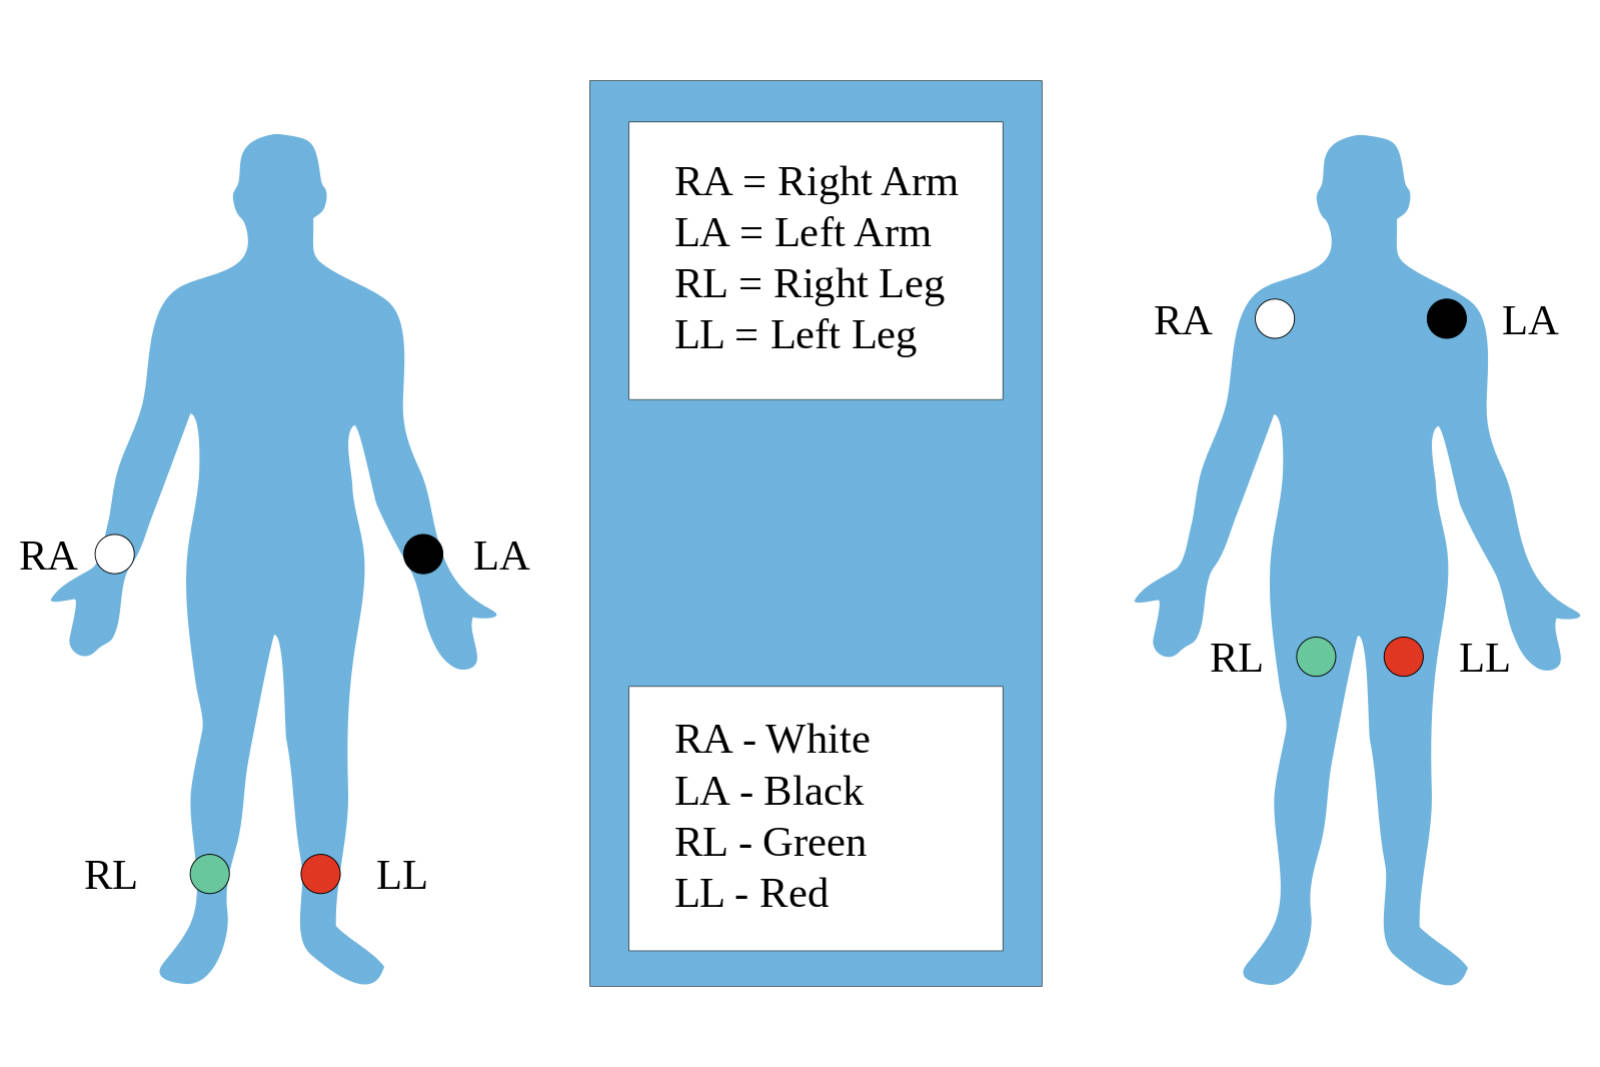
RA (Right Arm):
This electrode is typically represented by the color white in the American Heart Association (AHA) coding system. It is placed on the right wrist for a standard diagnostic ECG or on the right shoulder (in the infraclavicular fossa) for continuous monitoring, serving as a negative pole for Lead I and Lead II.
LA (Left Arm):
Identified by the color black, this electrode is positioned on the left wrist or the left shoulder area, mirroring the placement of the right arm electrode. Physiologically, it acts as the positive electrode for Lead I and the negative electrode for Lead III, helping to capture the lateral electrical forces of the heart.
RL (Right Leg):
This electrode is color-coded green and is placed on the right ankle or the lower right abdomen/torso depending on the clinical setting. Its primary function is to serve as a ground or neutral reference point, minimizing electrical interference and stabilizing the baseline of the ECG tracing.
LL (Left Leg):
Represented by the color red, this electrode is attached to the left ankle or the lower left torso. It plays a critical role as the positive electrode for both Lead II and Lead III, capturing the inferior electrical vectors that travel downward through the heart’s conduction system.
The Physiology of Bipolar Limb Leads
The four electrodes described above are not simply passive sensors; they are arranged to form specific “leads” or angles of view. In electrocardiography, a “lead” does not refer to the physical wire, but rather to the voltage difference measured between two points. The standard limb leads (I, II, and III) are bipolar, meaning they measure the electrical potential difference between a positive and a negative electrode. This arrangement allows the machine to detect the magnitude and direction of the electrical impulses generated by the sinoatrial node and conducting tissues.
When these electrodes are placed correctly on the extremities or torso, they create a theoretical geometric formation known as Einthoven’s Triangle. This imaginary equilateral triangle surrounds the heart, with the heart functioning as the electrical center. The specific placement ensures that the electrical axis of the heart can be calculated. For instance, if the electrical wave moves toward a positive electrode, the ECG machine records an upward (positive) deflection. If it moves away, the deflection is downward (negative).
Accuracy in placement is paramount because shifting the electrodes from the distal limbs (wrists/ankles) to the torso (Mason-Likar placement) can subtly alter the shape of the waveform and the electrical axis. While torso placement is common in telemetry and stress testing to reduce motion artifact, diagnostic resting ECGs typically prefer the distal limb placement to adhere to standard calibration.
- Correct limb lead placement is essential for:
- Accurate calculation of the heart’s electrical axis.
- Clear detection of inferior wall ischemia (via Leads II, III, and aVF).
- Proper identification of atrial activity (P-waves), which are best seen in Lead II.
- Minimizing “muscle tremor” artifacts that can mimic arrhythmias.
Anatomy of the Electrical Vectors
To understand why the RA, LA, RL, and LL positions are so specific, one must understand the anatomy of cardiac depolarization. The heart’s electrical signal generally travels from the upper right chamber (atrium) to the lower left chamber (ventricle). This creates a primary vector that moves downward and to the left. Lead II, which connects the Right Arm (negative) to the Left Leg (positive), follows this natural pathway almost perfectly. This is why Lead II usually presents the clearest picture of the normal sinus rhythm and is the most commonly monitored lead in emergency settings.
Lead I measures the difference between the Right Arm and Left Arm, providing a view of the lateral wall of the left ventricle. Lead III measures the difference between the Left Arm and Left Leg, looking at the inferior surface of the heart. Together with the augmented unipolar leads (aVR, aVL, aVF), which are mathematically derived from these same four sensors, the limb leads provide a complete frontal plane view of cardiac activity. This 360-degree perspective allows clinicians to detect conduction blocks, hypertrophy, and infarctions.
Clinical Considerations for Signal Quality
The fidelity of the electrocardiogram signal relies heavily on the interface between the electrode and the skin. The outer layer of human skin, the stratum corneum, acts as a resistor. To obtain a crisp signal free of “noise,” the skin at the RA, LA, RL, and LL sites should be clean, dry, and free of excessive hair or oil. In many clinical protocols, mild abrasion of the skin is recommended to lower electrical impedance.
Furthermore, the placement illustrated in the image highlights the importance of symmetry. Whether the electrodes are placed on the wrists and ankles or brought in closer to the torso, the Left and Right counterparts should be level with each other. Asymmetry can artificially shift the electrical axis, potentially leading to a misdiagnosis of conditions like hemiblocks or ventricular enlargement. The green RL electrode, while serving as a ground, is equally important; without a solid ground connection, the tracing can be overwhelmed by 60-cycle interference from nearby electrical equipment (like lights or IV pumps), rendering the ECG unreadable.
Conclusion
The proper application of the RA, LA, RL, and LL electrodes is the fundamental skill upon which all electrocardiography is built. These four sensors allow for the derivation of the six limb leads, providing the essential data needed to construct Einthoven’s Triangle and analyze the heart’s electrical health. By adhering to anatomical landmarks and ensuring consistent skin preparation, healthcare providers ensure that the resulting tracings are accurate, allowing for the timely diagnosis and treatment of cardiac conditions.

