Blood pressure measurement is a cornerstone of assessing cardiovascular health, utilizing tools like the sphygmomanometer to detect vital signs. This diagram illustrates the relationship between arterial pressure changes and Korotkoff sounds, providing a clear visual guide to determining systolic blood pressure and diastolic blood pressure during cuff deflation.
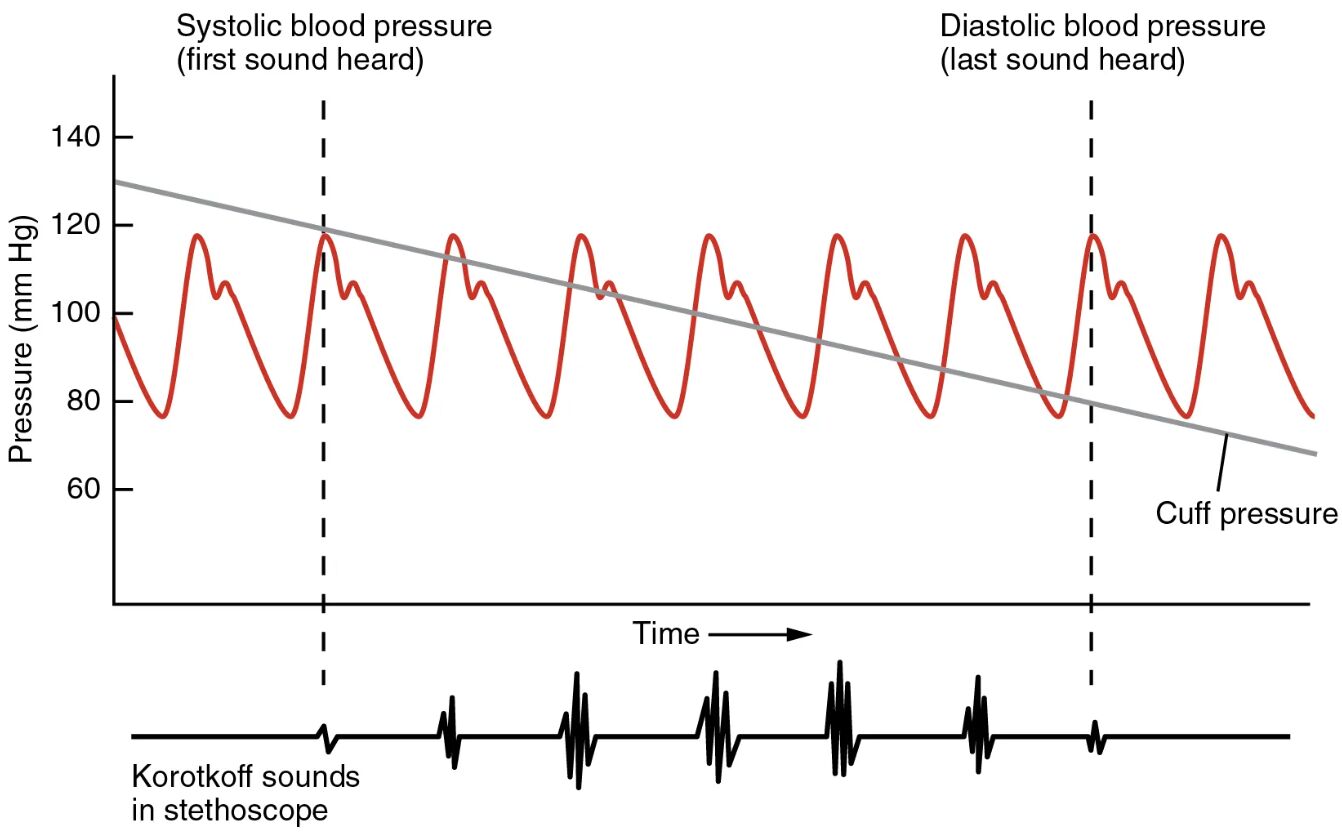
Systolic blood pressure Systolic blood pressure marks the pressure when the heart contracts, pushing blood into the arteries, and is identified by the first Korotkoff sound heard. It typically ranges from 90 to 120 mmHg in healthy individuals, reflecting the force exerted during ventricular systole.
Diastolic blood pressure Diastolic blood pressure indicates the pressure in the arteries when the heart is at rest between beats, noted by the last Korotkoff sound. This value, usually 60-80 mmHg, represents the baseline pressure maintained by arterial elasticity and peripheral resistance.
Cuff pressure Cuff pressure is the controlled pressure applied by the sphygmomanometer cuff, gradually released to align with arterial pressure changes. It serves as the reference point for detecting the transition from silence to Korotkoff sounds and their eventual disappearance.
Korotkoff sounds in stethoscope Korotkoff sounds in stethoscope are the audible tapping or whooshing noises heard through a stethoscope as cuff pressure decreases, corresponding to blood flow turbulence. These sounds, first described by Nikolai Korotkoff, occur in phases and guide the precise measurement of blood pressure.
Time Time on the graph represents the duration over which the cuff pressure is released, aligning arterial pressure oscillations with Korotkoff sound phases. This temporal axis helps correlate the dynamic pressure changes with audible cues for accurate reading.
Overview of Blood Pressure Measurement
The diagram provides a visual representation of how blood pressure is measured using the auscultatory method. It connects the physical pressure in the arteries with the clinical technique of listening to Korotkoff sounds.
- Systolic blood pressure is the initial point where blood flow resumes audibly, marking the start of phase I Korotkoff sounds.
- Diastolic blood pressure corresponds to the muffling or disappearance of these sounds, typically phase V.
- Cuff pressure must exceed systolic pressure initially to occlude the artery, then decrease gradually for measurement.
- Korotkoff sounds in stethoscope evolve from loud taps to soft murmurs, reflecting changing blood flow dynamics.
- Time ensures the process is methodical, allowing for precise identification of pressure points.
The Science Behind Blood Pressure Readings
Understanding the physiological basis of blood pressure measurement enhances its accuracy. The interplay of cardiac output and vascular resistance drives these readings.
- Systolic blood pressure rises with increased stroke volume or arterial stiffness, common in conditions like hypertension.
- Diastolic blood pressure is influenced by peripheral resistance and vascular tone, modulated by the autonomic nervous system.
- Cuff pressure mimics the arterial wall’s response, creating a controlled environment to detect flow changes.
- Korotkoff sounds in stethoscope result from turbulent flow as the cuff pressure falls below systolic, transitioning to laminar flow at diastolic.
- The process relies on the brachial artery’s compliance, typically measured at the upper arm.
Role of Korotkoff Sounds
Korotkoff sounds are the auditory hallmark of blood pressure measurement. Their phases provide a structured approach to reading pressure values.
- Phase I begins with the first clear tapping sound, aligning with systolic blood pressure.
- Phase II and III involve a swishing noise, indicating partial flow as cuff pressure decreases.
- Phase IV marks muffling, while phase V, the silence, denotes diastolic blood pressure.
- Variations in sound clarity can occur due to cuff size or patient factors like obesity.
- Proper stethoscope placement over the brachial artery ensures accurate Korotkoff sounds in stethoscope.
Importance of Cuff Pressure and Time
The controlled release of cuff pressure over time is critical for reliable measurements. This technique balances precision with patient comfort.
- Cuff pressure should start 20-30 mmHg above the expected systolic value to occlude the artery fully.
- A deflation rate of 2-3 mmHg per second along the time axis prevents missing transitional sounds.
- Rapid deflation can lead to underestimating systolic blood pressure or overestimating diastolic blood pressure.
- Time allows the clinician to correlate pressure drops with Korotkoff sounds in stethoscope, ensuring consistency.
- Adjusting cuff pressure based on patient size improves accuracy in pediatric or obese individuals.
Clinical Applications and Considerations
This measurement technique is widely used to monitor health and diagnose conditions. It provides a non-invasive way to track cardiovascular status over time.
- Elevated systolic blood pressure may indicate early hypertension, requiring lifestyle or pharmacological intervention.
- Low diastolic blood pressure could suggest vasodilation or heart failure, affecting coronary perfusion.
- Incorrect cuff pressure application can lead to errors, emphasizing the need for proper training.
- Korotkoff sounds in stethoscope may be absent in severe atherosclerosis, necessitating alternative methods like Doppler.
- Regular measurement over time helps track trends, aiding in managing chronic conditions.
In conclusion, the blood pressure measurement diagram is an essential tool for understanding the auscultatory method’s mechanics. By mastering the interpretation of systolic blood pressure, diastolic blood pressure, cuff pressure, Korotkoff sounds in stethoscope, and time, one can ensure accurate assessments that support effective patient care. This knowledge not only enhances clinical practice but also deepens the appreciation of the cardiovascular system’s intricate balance.

