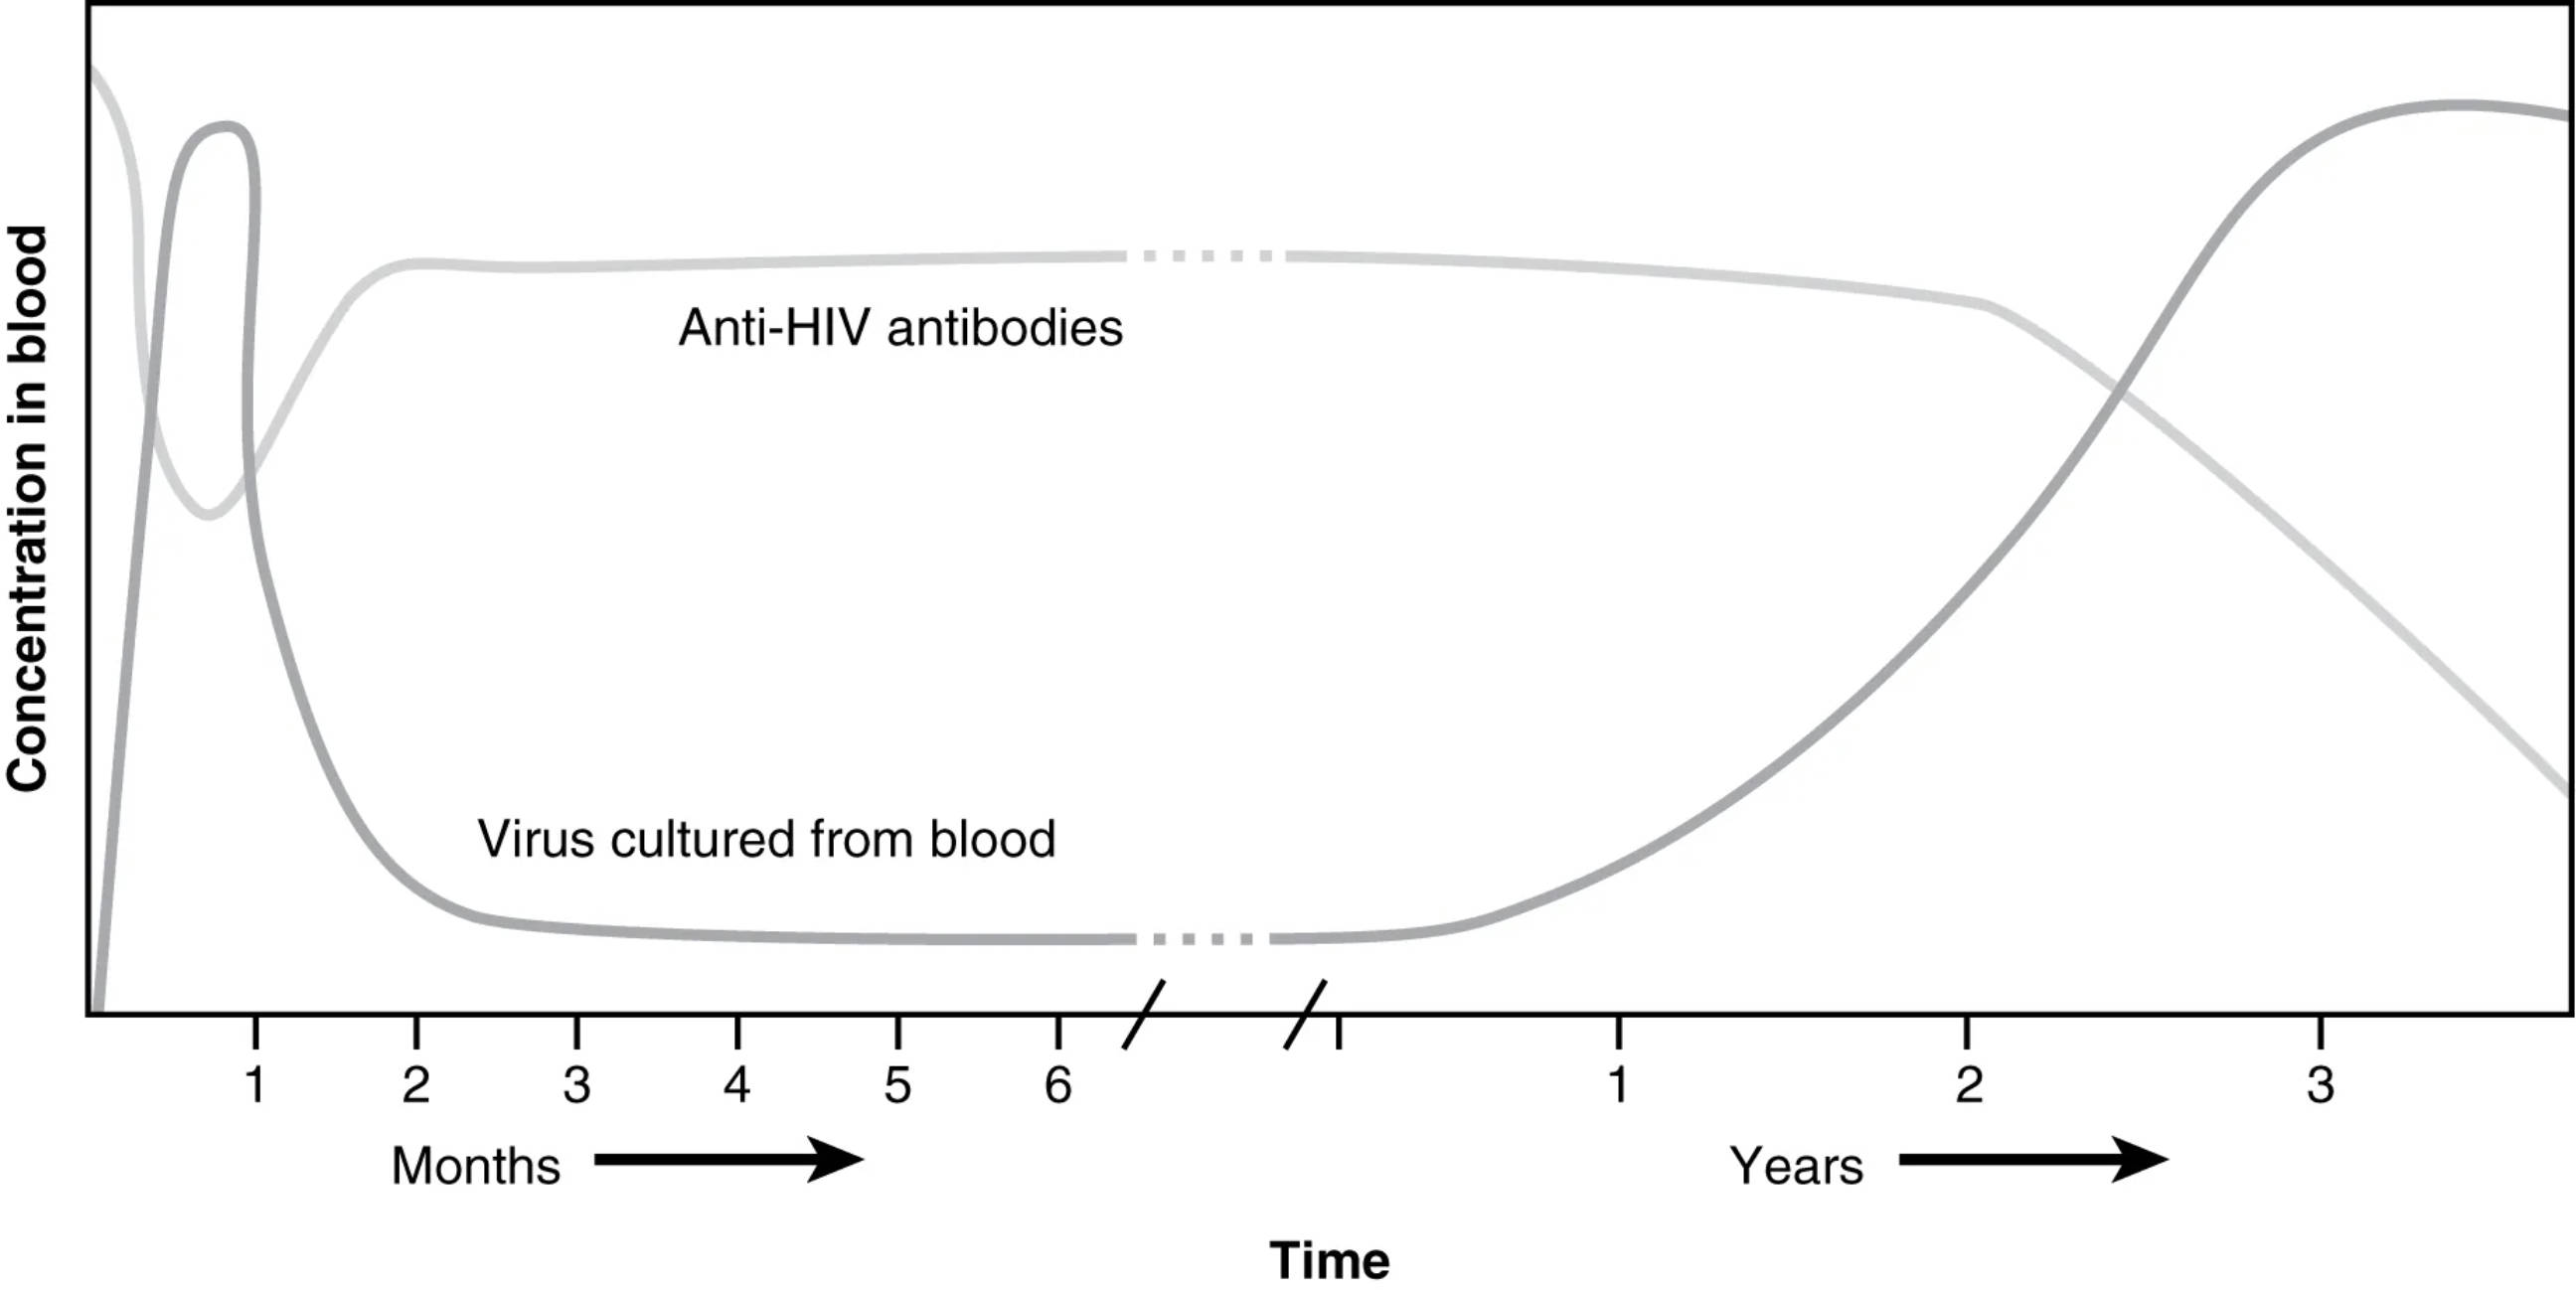
HIV, or Human Immunodeficiency Virus, poses a significant challenge to the immune system, with its progression marked by distinct phases that can be tracked through antibody and virus levels. This graph illustrates the initial seroconversion period, where anti-HIV antibodies rise and virus levels drop, followed by a gradual decline in immune function leading to AIDS. Exploring this progression provides valuable insights into the virus’s impact and the limitations of the body’s natural defenses against it.
Key Labels in the HIV Progression Graph
This section explores each labeled element, offering a clear picture of how HIV affects the immune system over time.
Concentration in blood: This vertical axis measures the levels of anti-HIV antibodies and virus cultured from the blood, reflecting the immune response and viral load. Higher concentrations indicate either a robust antibody production or significant viral replication, depending on the curve.
Anti-HIV antibodies: This dashed line represents the rise and stabilization of antibodies produced by the immune system in response to HIV infection. The initial increase occurs during seroconversion, though these antibodies ultimately fail to control the virus long-term.
Virus cultured from blood: This solid line shows the concentration of HIV particles detectable in the blood, peaking early after infection and declining temporarily. The resurgence of viral load later signifies the progression toward AIDS as immune defenses weaken.
Months: This segment of the time axis covers the first six months post-infection, highlighting the acute and early chronic phases. It is the period when seroconversion and initial immune responses are most active.
Years: This part of the time axis extends beyond the initial months, tracking the chronic phase and progression to AIDS over several years. It reflects the long-term decline in immune function despite antibody presence.
Time: This horizontal axis tracks the overall duration of HIV infection, divided into months and years. It provides a timeline for observing the dynamic interplay between viral load and antibody levels.
The Phases of HIV Disease Progression
HIV infection unfolds in distinct stages, each characterized by changes in viral and antibody levels. This process offers a window into the virus’s impact on immunity.
- The initial phase begins with high virus cultured from blood, as the virus rapidly replicates after entry.
- Within weeks to months, anti-HIV antibodies rise during seroconversion, marking the immune system’s attempt to combat the infection.
- Viral load temporarily decreases as antibodies peak, but the virus persists in latent reservoirs.
- Over years, the immune system weakens, allowing viral levels to rise again, leading to AIDS.
- This progression underscores the inability of natural antibody responses to eradicate HIV.
Seroconversion: The Early Immune Response
Seroconversion is a critical early event in HIV infection. It reflects the body’s initial mobilization against the virus.
- Anti-HIV antibodies begin to appear within weeks, detectable through blood tests, signaling seroconversion.
- This period coincides with a decline in virus cultured from blood as the immune response temporarily suppresses replication.
- Symptoms like fever or rash may occur, indicating acute retroviral syndrome.
- The antibody response, however, is insufficient to clear the virus, setting the stage for chronic infection.
- CD4 T cell counts start to decline, though this is not yet visible on the graph.
Progression to AIDS: Immune System Collapse
Over time, HIV progresses to AIDS, marked by a resurgence of viral activity. This phase highlights the failure of adaptive immunity.
- Virus cultured from blood increases again as CD4 T cells drop below critical levels, typically after years.
- Anti-HIV antibodies remain present but lose effectiveness as the immune system deteriorates.
- Opportunistic infections emerge, defining the AIDS stage due to compromised immunity.
- The graph shows a steady rise in viral load, correlating with severe immune suppression.
- Antiretroviral therapy (ART) is essential to manage this phase and prevent further decline.
Physiological and Clinical Implications
The dynamics of HIV progression have significant physiological and clinical relevance. They guide treatment and monitoring strategies.
- The initial drop in virus cultured from blood reflects partial immune control, mediated by humoral and cellular responses.
- Chronic inflammation from persistent viral activity damages tissues, including the lymphoid system.
- Anti-HIV antibodies include IgG and IgM, but their neutralizing capacity wanes over time.
- CD4 T cell depletion leads to increased susceptibility to infections like Pneumocystis pneumonia.
- Regular viral load and CD4 count monitoring are critical for assessing disease stage and treatment efficacy.
Managing HIV: Therapeutic Approaches
Understanding HIV progression informs clinical interventions. Effective management can alter the disease course significantly.
- Antiretroviral therapy suppresses virus cultured from blood, restoring immune function if started early.
- Boosting anti-HIV antibodies through vaccines remains a research goal, though current options are limited.
- Prophylactic treatments prevent opportunistic infections in advanced stages.
- Adherence to ART maintains viral suppression, preventing progression to AIDS.
- Patient education on medication adherence is vital for long-term health outcomes.
In conclusion, the graph of HIV disease progression illustrates the complex interplay between viral replication and immune response. While seroconversion marks an initial antibody surge, the eventual rise in viral load and immune collapse highlight the need for ongoing medical intervention. This visual representation serves as a powerful tool for understanding HIV’s impact and the importance of timely treatment to manage its progression effectively.

