Explore the distinctive electrocardiogram (ECG) features of Wolff-Parkinson-White (WPW) Syndrome, a pre-excitation disorder with significant clinical implications. This article provides a detailed explanation of the characteristic delta wave, short PR interval, and wide QRS complex, crucial for accurate diagnosis and management.
aVR, aVL, aVF, V1-V6, I, II, III: These labels represent the standard 12 leads of an electrocardiogram (ECG), each recording the heart’s electrical activity from a different angle. The systematic placement of electrodes allows for a comprehensive assessment of cardiac depolarization and repolarization.
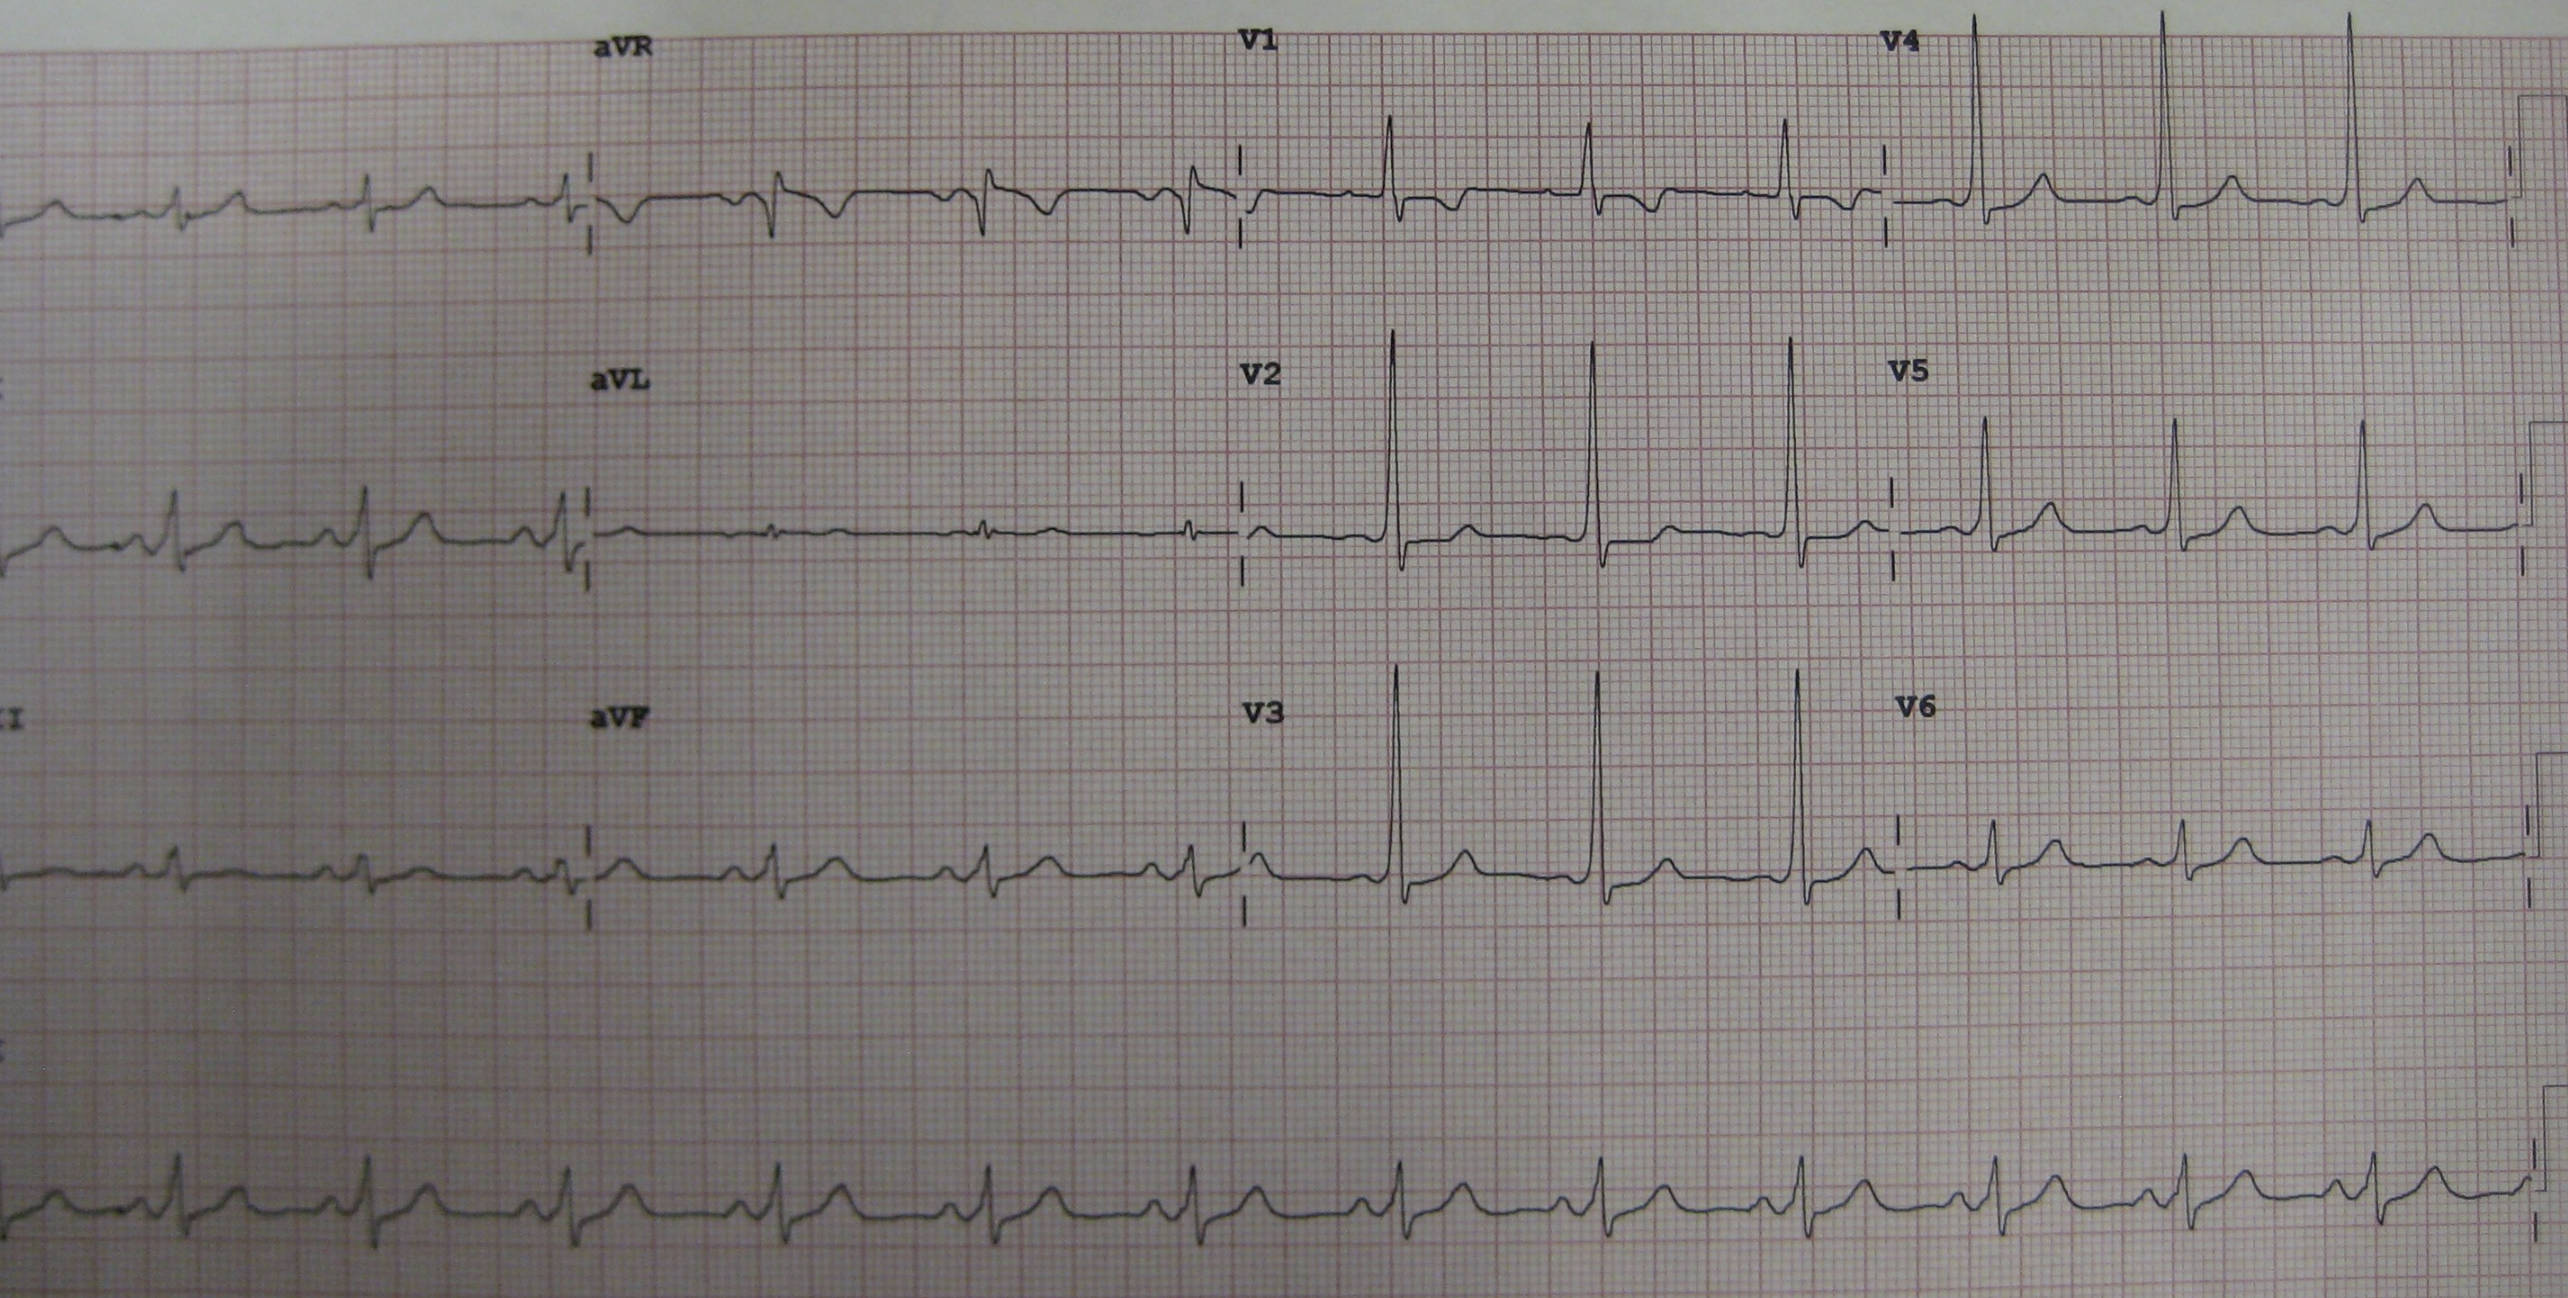
12 lead ECG demonstrating WPW: This image displays a 12-lead electrocardiogram tracing that clearly exhibits the characteristic electrical findings associated with Wolff-Parkinson-White (WPW) Syndrome. These specific patterns are crucial for diagnosing this cardiac pre-excitation disorder.
An electrocardiogram (ECG or EKG) is a cornerstone diagnostic tool in cardiology, providing a non-invasive graphical representation of the heart’s electrical activity. By recording the tiny electrical impulses that propagate through the cardiac muscle with each beat, an ECG offers invaluable insights into the heart’s rhythm, conduction system, and the presence of various cardiac pathologies. Among the many conditions identifiable by an ECG, Wolff-Parkinson-White (WPW) Syndrome stands out due to its unique electrical signature and potential for serious arrhythmias. Understanding the characteristic ECG findings of WPW is paramount for timely diagnosis and appropriate patient management.
Wolff-Parkinson-White Syndrome is a congenital cardiac condition characterized by the presence of an accessory pathway, also known as a bypass tract or bundle of Kent, that electrically connects the atria to the ventricles. This accessory pathway bypasses the normal delay imposed by the atrioventricular (AV) node, leading to premature ventricular activation, a phenomenon called pre-excitation. While many individuals with WPW may remain asymptomatic, the presence of this extra pathway creates a substrate for re-entrant tachycardias, including atrioventricular re-entrant tachycardia (AVRT) and, more dangerously, rapid conduction of atrial fibrillation to the ventricles, which can degenerate into ventricular fibrillation and sudden cardiac death.
The ECG tracing provided serves as an excellent illustration of the classic triad of findings that characterize WPW Syndrome. These distinct electrical patterns are crucial for identifying the presence of an accessory pathway and assessing the risk of associated arrhythmias. Recognizing these specific features on a 12-lead ECG is a critical skill for clinicians in diagnosing this significant cardiac condition and guiding therapeutic decisions.
- WPW Syndrome involves an accessory pathway bypassing the AV node.
- It leads to premature ventricular activation (pre-excitation).
- Characteristic ECG triad: short PR, delta wave, wide QRS.
- WPW increases risk of re-entrant tachycardias and sudden cardiac death.
The hallmark ECG features of WPW Syndrome, clearly visible in the provided image, constitute a classic triad. Firstly, a short PR interval (typically <0.12 seconds or 120 ms) is observed. This occurs because the electrical impulse travels directly from the atria to the ventricles via the accessory pathway, bypassing the physiological delay at the AV node. Consequently, ventricular activation begins earlier than normal, shortening the time between atrial depolarization (P wave) and ventricular depolarization (QRS complex).
Secondly, the presence of a delta wave is a definitive sign of pre-excitation. This is a slurred upstroke at the beginning of the QRS complex, representing the early, slow ventricular activation through the accessory pathway before the normal conduction system fully engages. The shape and polarity of the delta wave can vary depending on the location of the accessory pathway. On the presented ECG, the delta wave is clearly discernible in multiple leads, particularly prominent in leads like V4-V6 and inferior leads.
Thirdly, the QRS complex is typically widened (usually >0.10 seconds or 100 ms). This widening is due to the fusion of the slow ventricular activation through the accessory pathway (delta wave) and the subsequent rapid activation via the normal His-Purkinje system. The combination of these three findings—short PR interval, delta wave, and wide QRS complex—is highly indicative of WPW Syndrome. The location of the accessory pathway influences the specific morphology of these ECG changes across the 12 leads.
Diagnosing WPW Syndrome is typically done via ECG, especially during sinus rhythm. For symptomatic individuals, management often involves catheter ablation of the accessory pathway, which has a high success rate and can eliminate the risk of tachyarrhythmias. For asymptomatic individuals, risk stratification is crucial, as some may still be at risk for sudden cardiac death. Electrophysiology studies can assess the refractory period of the accessory pathway, guiding decisions on whether intervention is warranted. Certain antiarrhythmic drugs may also be used, though drugs that block the AV node (e.g., adenosine, beta-blockers, calcium channel blockers) are generally contraindicated during atrial fibrillation with WPW, as they can preferentially block the normal pathway, increasing conduction down the accessory pathway and accelerating ventricular rates, potentially leading to ventricular fibrillation.
In conclusion, the 12-lead electrocardiogram is an invaluable tool for identifying Wolff-Parkinson-White Syndrome through its characteristic triad of a short PR interval, a delta wave, and a widened QRS complex. This pre-excitation pattern signifies the presence of an accessory pathway that bypasses the normal cardiac conduction system. Early and accurate diagnosis of WPW Syndrome is crucial, not only for managing symptomatic tachyarrhythmias but also for risk stratifying asymptomatic individuals due to the potential for life-threatening events like sudden cardiac death. Advanced understanding of these ECG features enables clinicians to implement appropriate therapeutic strategies, ranging from medication to catheter ablation, significantly improving patient outcomes.

