Explore the characteristic electrocardiogram findings in Hypertrophic Obstructive Cardiomyopathy (HOCM), a common genetic heart condition. This article provides detailed insights into the ECG features associated with HOCM, their clinical significance, and the importance of early diagnosis.
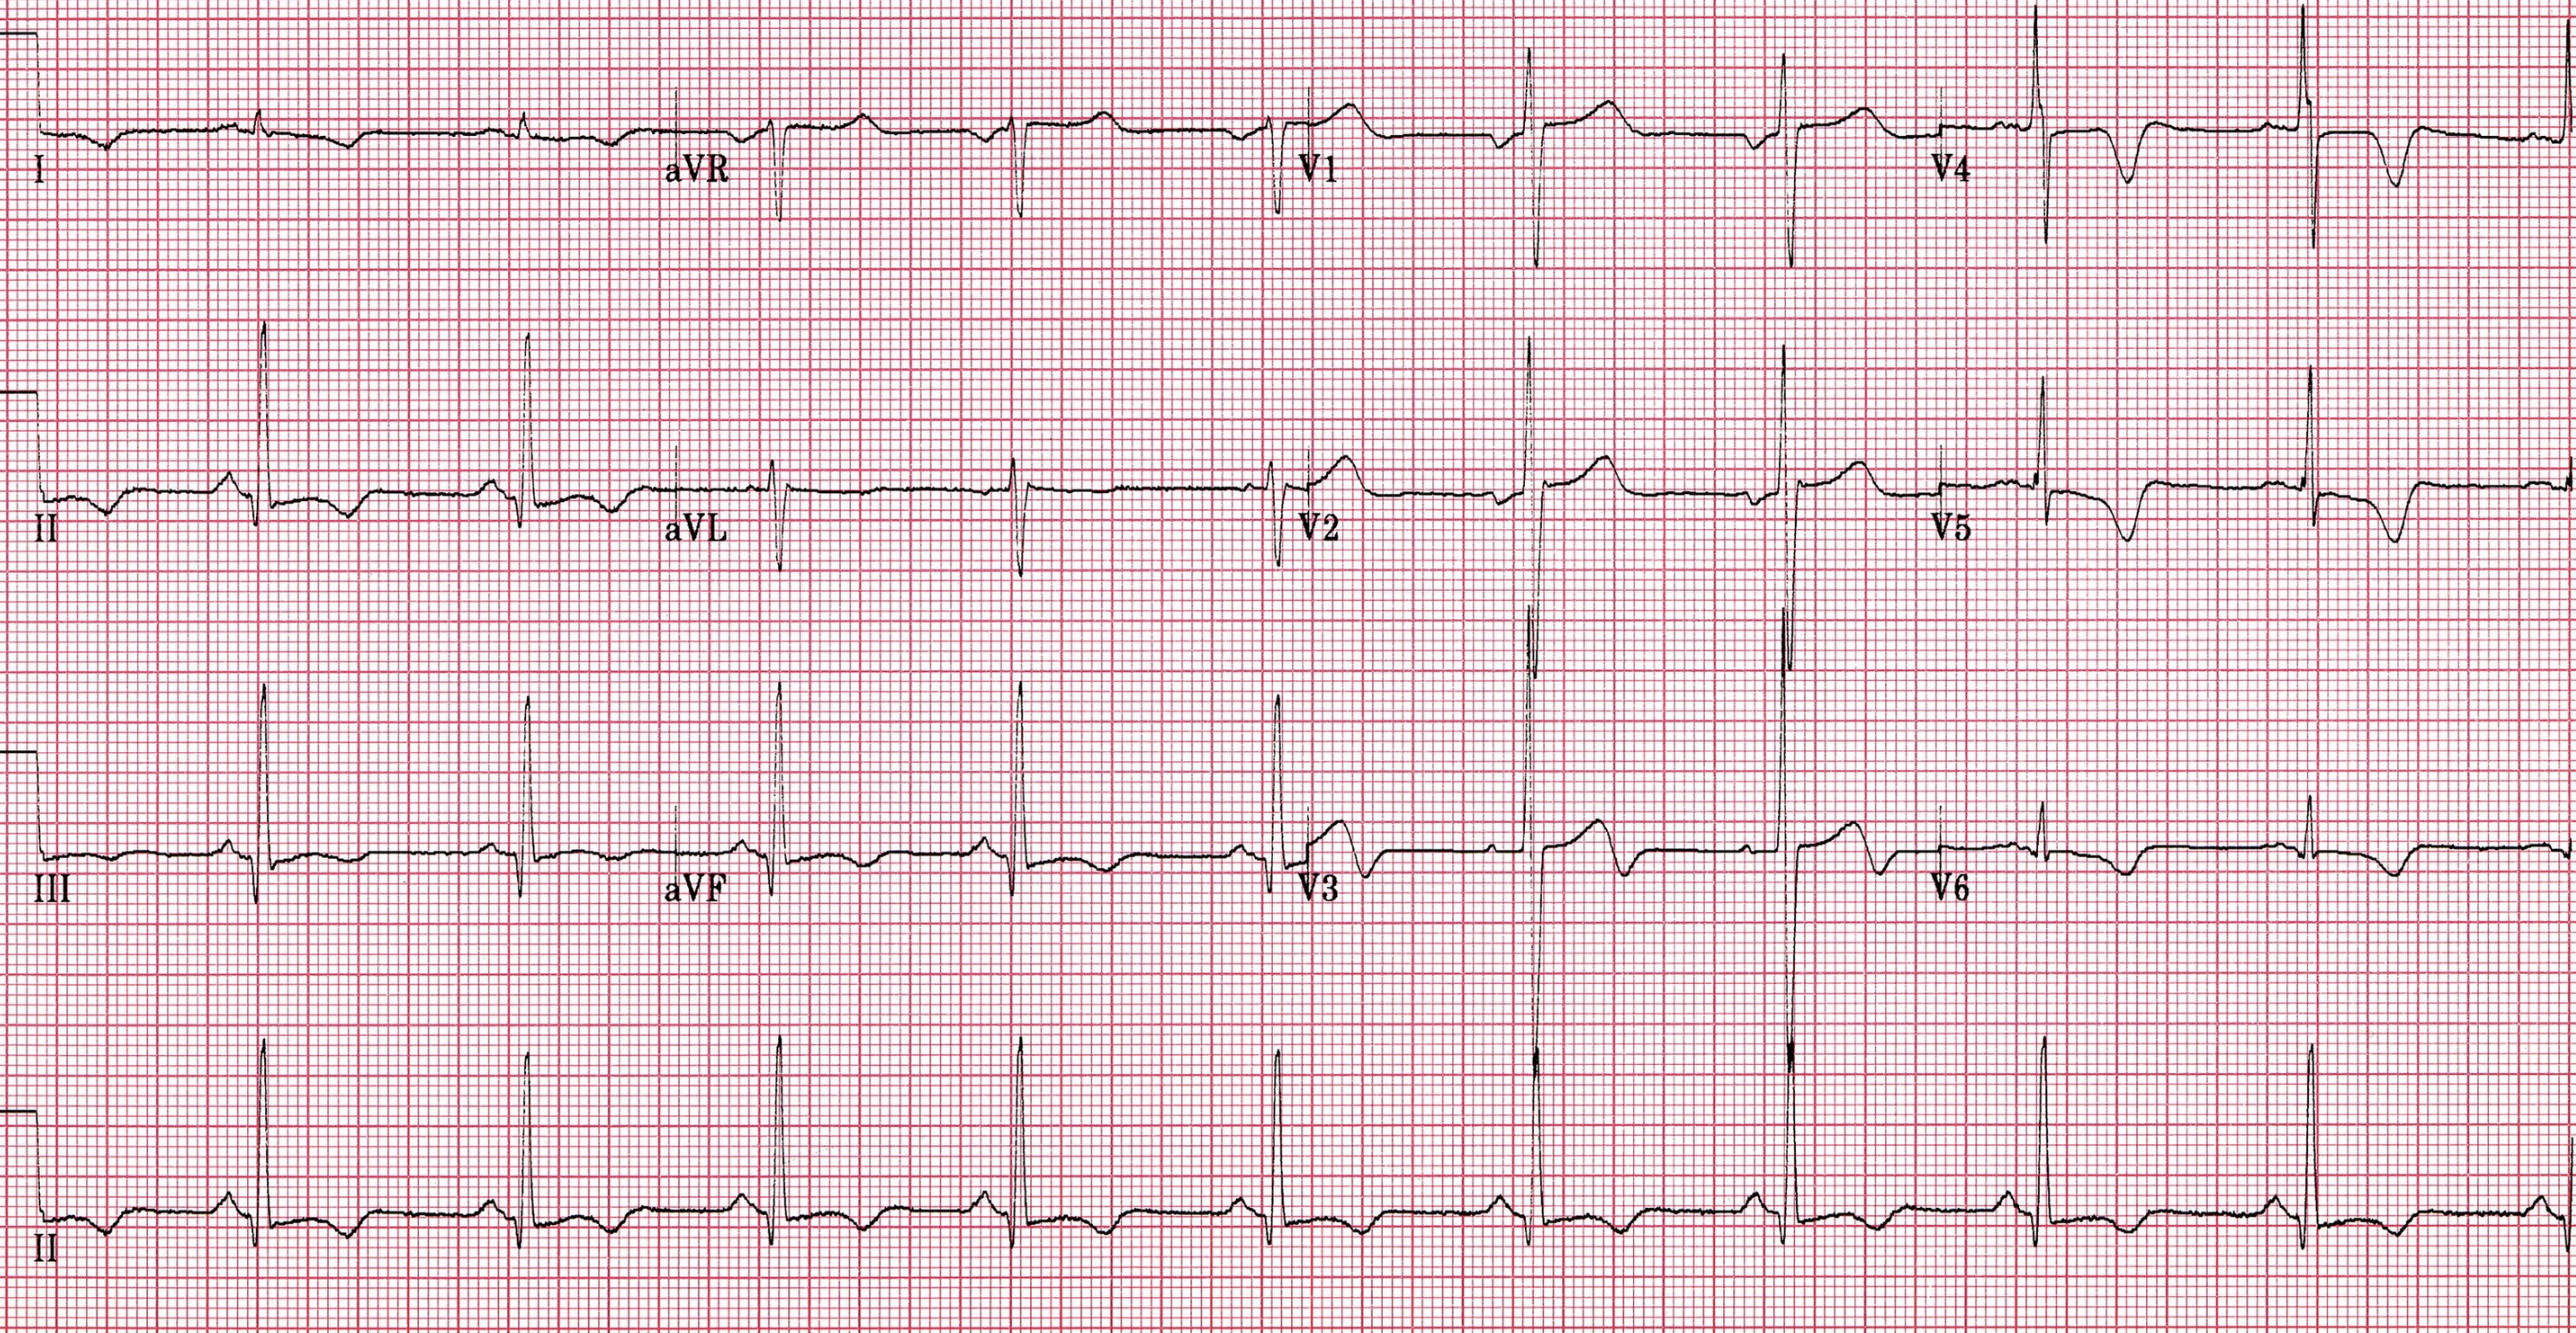
I, II, III, aVR, aVL, aVF, V1-V6: These labels represent the standard 12 leads of an electrocardiogram (ECG), each providing a unique electrical perspective on the heart’s activity. The consistent grid pattern of small (1mm) and large (5mm) squares allows for precise measurement of intervals and amplitudes, crucial for accurate interpretation.
An ECG showing HOCM: This image displays an electrocardiogram tracing that exhibits features consistent with Hypertrophic Obstructive Cardiomyopathy (HOCM). Such ECG findings are vital clues for clinicians in diagnosing and managing this significant cardiac condition.
An electrocardiogram (ECG or EKG) is an indispensable diagnostic tool in cardiology, providing a non-invasive graphical representation of the electrical activity of the heart. By recording the tiny electrical impulses generated during each heartbeat, an ECG can reveal critical information about the heart’s rhythm, conduction system, and the presence of underlying cardiac diseases. Interpreting an ECG requires a nuanced understanding of cardiac electrophysiology and the various patterns that signify specific conditions. Among these, Hypertrophic Obstructive Cardiomyopathy (HOCM) presents with distinct ECG findings that are crucial for its diagnosis and management.
Hypertrophic Obstructive Cardiomyopathy (HOCM), also known as hypertrophic cardiomyopathy (HCM), is a common genetic heart disease characterized by unexplained thickening of the heart muscle, particularly the interventricular septum. This thickening can obstruct blood flow from the left ventricle to the aorta, leading to a variety of symptoms including shortness of breath, chest pain, palpitations, and syncope. HOCM is a significant cause of sudden cardiac death in young athletes and a leading cause of heart failure in any age group. Early identification through tools like the ECG is paramount for timely intervention and improved patient outcomes.
The ECG in HOCM often displays a constellation of abnormalities that reflect the underlying structural and electrical remodeling of the heart. These findings are not always definitively diagnostic on their own but, when considered alongside clinical presentation and other imaging modalities (like echocardiography), provide strong evidence for the condition. Recognizing these characteristic ECG patterns is a critical skill for cardiologists and primary care physicians alike.
- HOCM is a genetic heart disease causing heart muscle thickening.
- It can lead to sudden cardiac death, especially in young athletes.
- ECG is a crucial tool for early detection.
- Common ECG findings reflect left ventricular hypertrophy and altered electrical conduction.
One of the most common and striking ECG findings in HOCM is evidence of left ventricular hypertrophy (LVH). Due to the thickened heart muscle, the electrical forces generated by the left ventricle are increased, resulting in tall R waves in the left precordial leads (V5, V6) and deep S waves in the right precordial leads (V1, V2), often exceeding standard voltage criteria for LVH. The presence of significant Q waves, particularly in the inferior (II, III, aVF) and lateral (V5, V6) leads, is another hallmark. These Q waves are typically narrow and deep, sometimes mimicking myocardial infarction (heart attack), but they represent septal hypertrophy and abnormal septal depolarization rather than necrotic tissue.
Furthermore, ST-segment and T-wave abnormalities are frequently observed. These often manifest as ST-segment depression and T-wave inversions, particularly in the lateral and inferior leads. These changes, often asymmetric, are indicative of repolarization abnormalities secondary to the hypertrophy and altered myocardial perfusion. While not specific to HOCM, their presence in conjunction with other findings strengthens the diagnostic suspicion. Arrhythmias are also common in HOCM patients, ranging from atrial fibrillation to ventricular tachycardia, which can contribute to symptoms and increased risk of sudden cardiac death. The ECG may, therefore, also show evidence of these rhythm disturbances.
Diagnosing HOCM typically involves a combination of clinical evaluation, ECG, and echocardiography. Echocardiography, which provides detailed images of the heart’s structure and function, is usually confirmatory, demonstrating the characteristic left ventricular hypertrophy, especially of the interventricular septum, and often systolic anterior motion (SAM) of the mitral valve leading to outflow tract obstruction. Genetic testing can also identify specific mutations responsible for the condition. Once diagnosed, management strategies focus on symptom relief, preventing sudden cardiac death, and improving quality of life, which may include medications, implantable cardioverter-defibrillators (ICDs), and in some cases, surgical myectomy or alcohol septal ablation.
In conclusion, the electrocardiogram serves as an invaluable screening and diagnostic tool for Hypertrophic Obstructive Cardiomyopathy. The presence of left ventricular hypertrophy patterns, prominent Q waves, and ST-T wave abnormalities on an ECG should raise strong suspicion for HOCM, prompting further investigation with echocardiography. Early and accurate diagnosis of this genetic heart condition is paramount for implementing appropriate management strategies, mitigating the risk of serious complications such as sudden cardiac death, and ultimately improving the long-term prognosis and quality of life for affected individuals.

