Unravel the complex pathways of carbohydrate metabolism, a fundamental biological process that converts glucose into usable energy for the cell. This article delves into glycolysis, the Krebs cycle, and the electron transport chain, detailing how each stage contributes to the efficient production of ATP.
Understanding the Carbohydrate Metabolism Diagram
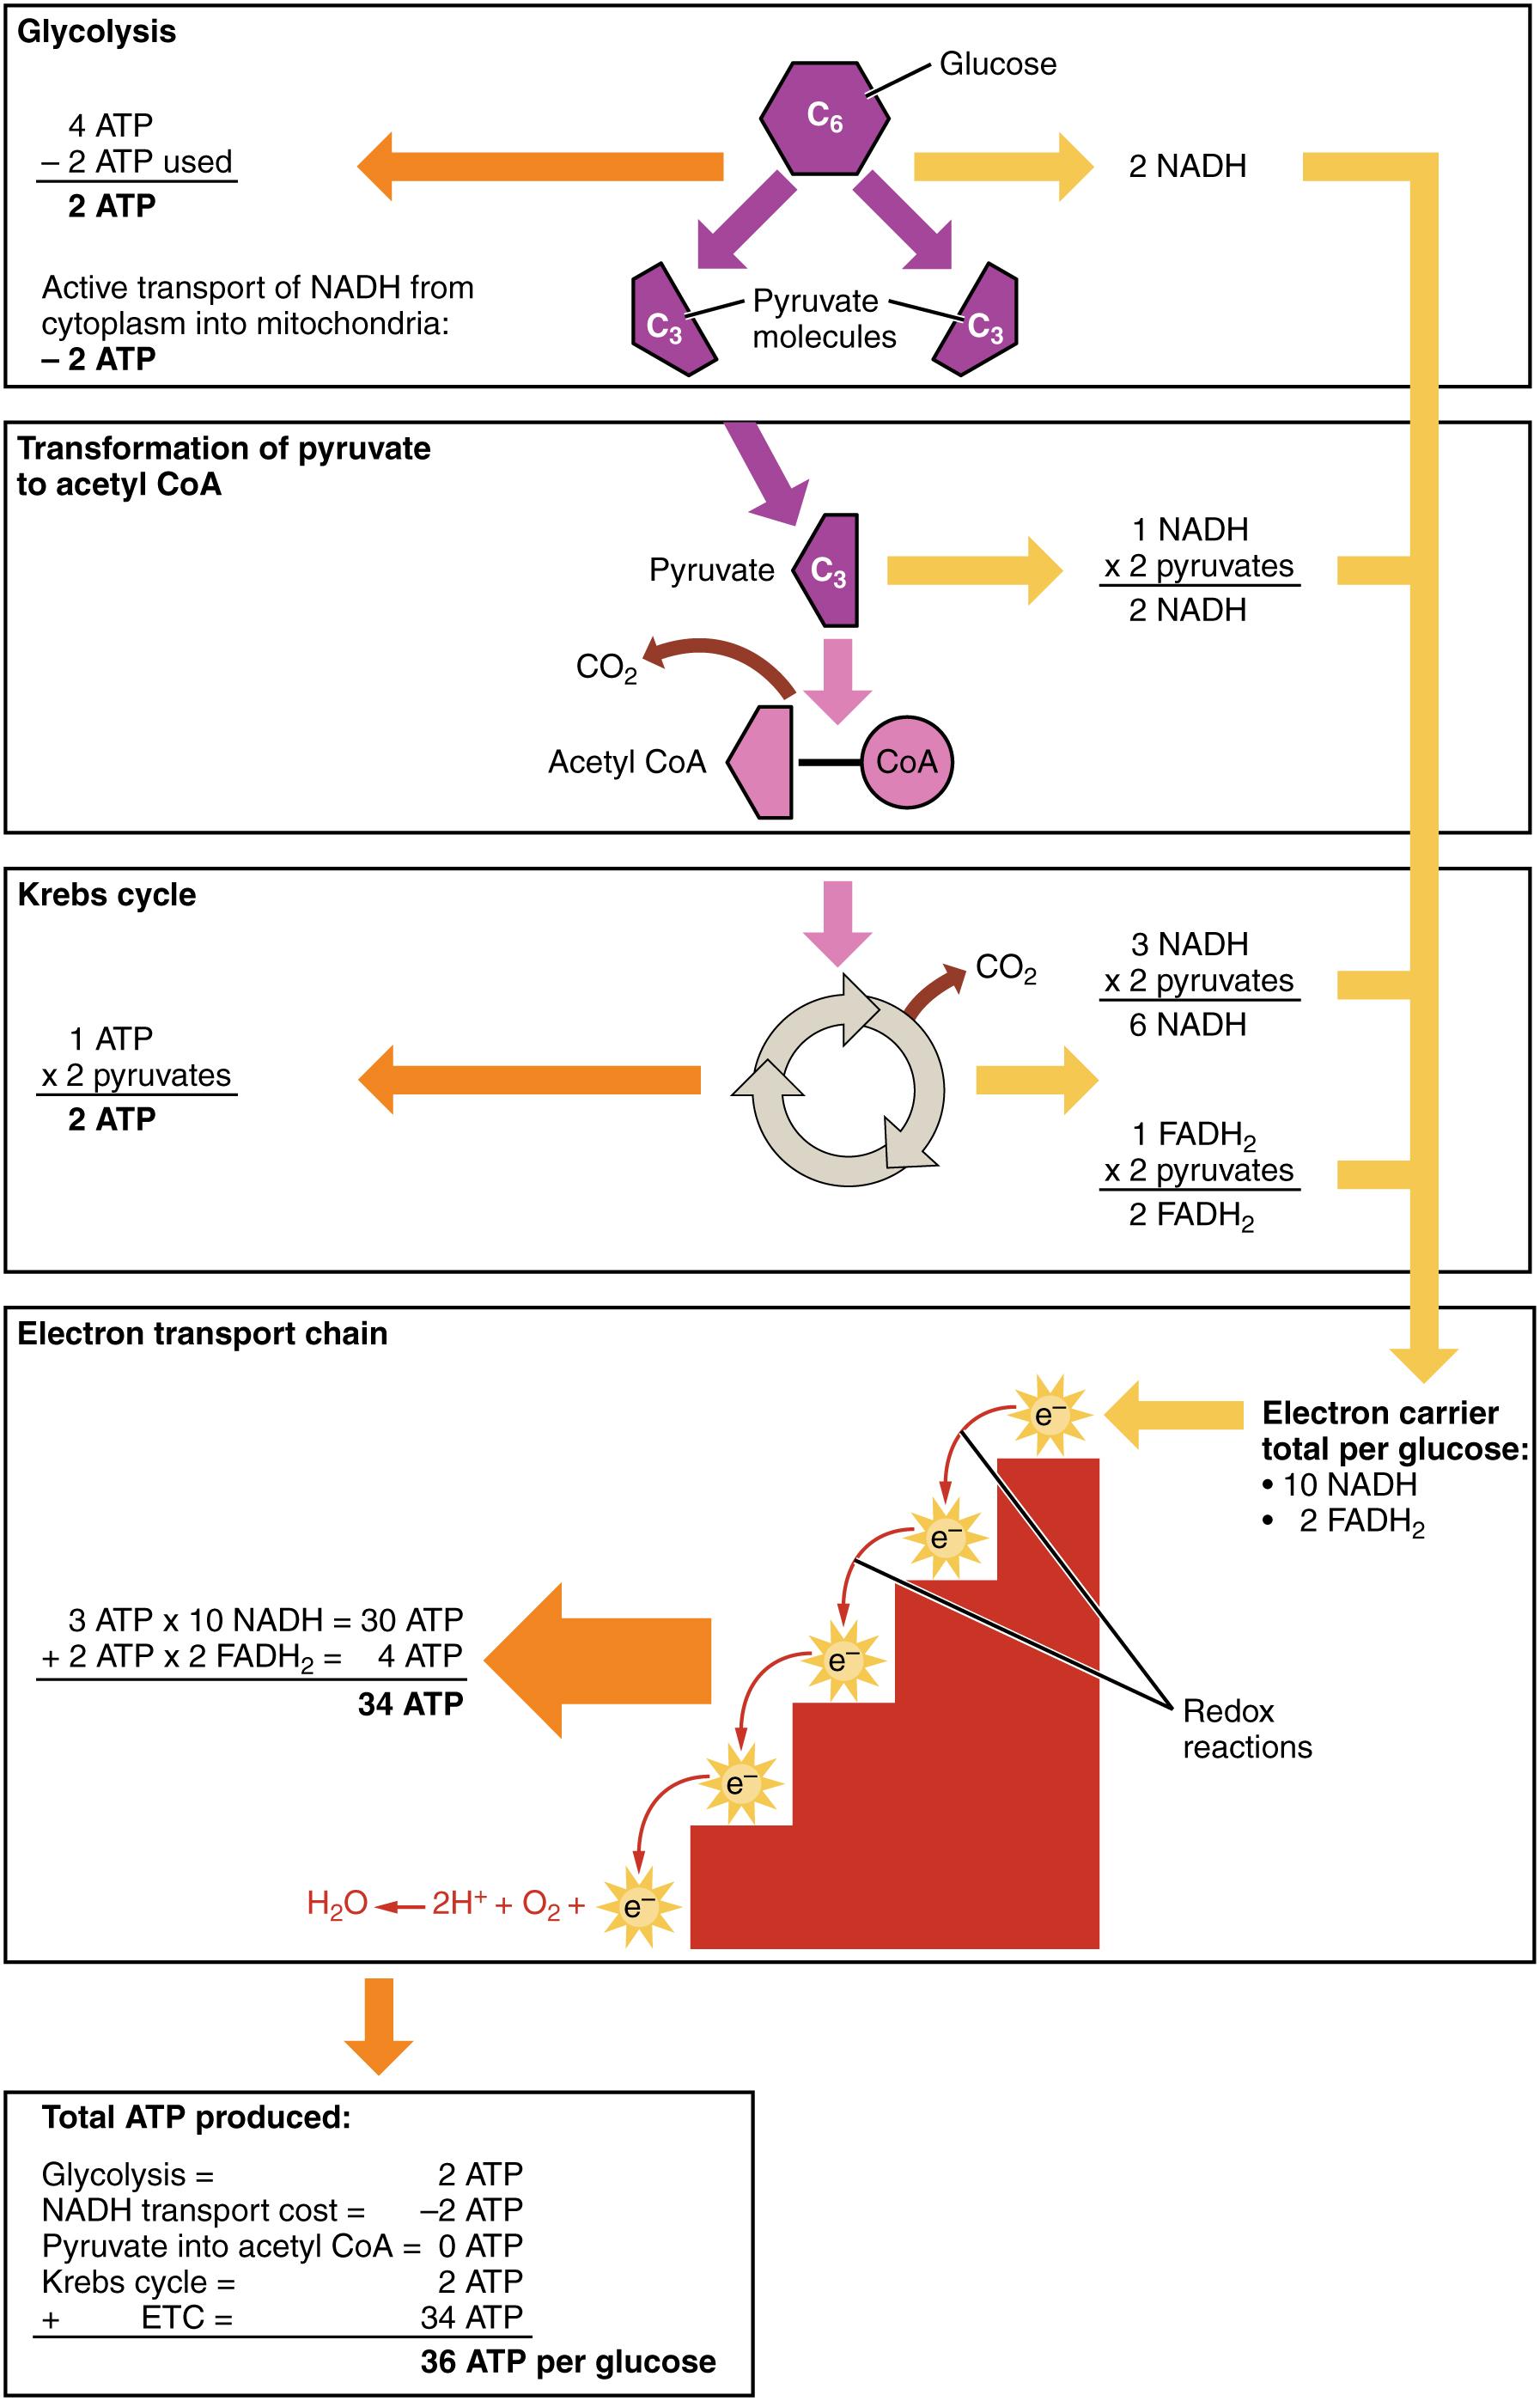
Glycolysis: This initial metabolic pathway breaks down a six-carbon glucose molecule into two three-carbon pyruvate molecules. It occurs in the cytoplasm and yields a net of 2 ATP molecules and 2 NADH molecules per glucose.
4 ATP: This represents the gross ATP produced during the glycolysis pathway. However, some ATP is consumed in the initial steps to prime the glucose molecule for breakdown.
– 2 ATP used: These 2 ATP molecules are consumed during the energy-investment phase of glycolysis. They are necessary to phosphorylate glucose and fructose-6-phosphate, making them more reactive for subsequent enzymatic reactions.
2 ATP: This is the net yield of ATP directly from glycolysis per glucose molecule. It is produced through substrate-level phosphorylation, a direct transfer of a phosphate group from a substrate to ADP.
Active transport of NADH from cytoplasm into mitochondria: This refers to the shuttle systems required to move the NADH produced during glycolysis in the cytoplasm into the mitochondrial matrix. Depending on the shuttle used, there is an energy cost associated with this transport.
– 2 ATP: This represents the energy cost (equivalent to 2 ATP) for actively transporting NADH from the cytoplasm into the mitochondria. This cost accounts for the reduced overall ATP yield from some glucose molecules.
C6 (Glucose): This refers to a six-carbon glucose molecule, the primary starting material for carbohydrate metabolism. Glucose is a simple sugar that serves as a vital energy source for most organisms.
Pyruvate molecules (C3 x 2): These are two three-carbon molecules resulting from the breakdown of one glucose molecule during glycolysis. Pyruvate is a crucial intermediate that can either proceed to the Krebs cycle under aerobic conditions or undergo fermentation under anaerobic conditions.
2 NADH: These are two molecules of reduced nicotinamide adenine dinucleotide produced during glycolysis. NADH carries high-energy electrons that will later be used in the electron transport chain to generate more ATP.
Transformation of pyruvate to acetyl CoA: This stage is an intermediate step between glycolysis and the Krebs cycle, occurring in the mitochondrial matrix. Each pyruvate molecule is converted into acetyl CoA, releasing carbon dioxide and generating NADH.
1 NADH x 2 pyruvates = 2 NADH: For each pyruvate molecule, one NADH is produced during its conversion to acetyl CoA. Since two pyruvates are formed from one glucose, a total of 2 NADH are generated at this stage.
CO2: Carbon dioxide is released as a byproduct during the oxidative decarboxylation of pyruvate to acetyl CoA. This marks the first release of carbon atoms from the original glucose molecule.
Acetyl CoA (CoA): Acetyl coenzyme A is a two-carbon molecule formed from pyruvate. It is the crucial molecule that enters the Krebs cycle, linking glycolysis and the preparatory step to the main oxidative pathway.
Krebs cycle: Also known as the citric acid cycle, this central metabolic pathway occurs in the mitochondrial matrix. It completely oxidizes the acetyl group from acetyl CoA, producing ATP, NADH, and FADH2.
1 ATP x 2 pyruvates = 2 ATP: For each turn of the Krebs cycle, one ATP (or GTP) molecule is directly produced through substrate-level phosphorylation. Since two acetyl CoA molecules (from two pyruvates) enter the cycle, a total of 2 ATP are generated at this stage.
3 NADH x 2 pyruvates = 6 NADH: Each turn of the Krebs cycle produces three NADH molecules. As two acetyl CoA molecules enter the cycle per glucose, a total of 6 NADH are generated from the Krebs cycle.
CO2: Carbon dioxide is released during the Krebs cycle as the acetyl group is fully oxidized. This accounts for the remaining carbon atoms from the original glucose molecule being expelled.
1 FADH2 x 2 pyruvates = 2 FADH2: Each turn of the Krebs cycle produces one FADH2 molecule. With two acetyl CoA molecules entering, a total of 2 FADH2 are generated during this cycle.
Electron transport chain: This final stage of aerobic respiration occurs on the inner mitochondrial membrane. It utilizes the high-energy electrons from NADH and FADH2 to generate a proton gradient, which drives the synthesis of the majority of cellular ATP.
Electron carrier total per glucose: 10 NADH, 2 FADH2: This summarizes all the electron carriers produced from the breakdown of one glucose molecule. These include NADH from glycolysis, pyruvate conversion, and the Krebs cycle, as well as FADH2 from the Krebs cycle.
Redox reactions: These are oxidation-reduction reactions that occur within the electron transport chain complexes. Electrons are passed sequentially from one carrier to the next, with each transfer releasing energy used to pump protons.
3 ATP x 10 NADH = 30 ATP: This calculation shows the approximate ATP yield from the 10 NADH molecules entering the electron transport chain. Each NADH typically yields about 2.5 to 3 ATPs.
2 ATP x 2 FADH2 = 4 ATP: This calculation shows the approximate ATP yield from the 2 FADH2 molecules entering the electron transport chain. Each FADH2 typically yields about 1.5 to 2 ATPs.
34 ATP: This represents the total approximate ATP generated by the electron transport chain from the electron carriers produced from one glucose molecule. It is the largest single contributor to ATP production.
H2O – 2H+ + O2 + e-: This equation illustrates the final step of the electron transport chain where oxygen acts as the terminal electron acceptor. It combines with electrons and protons to form water, a crucial step for the continuous flow of electrons.
Total ATP produced: This section summarizes the net ATP yield from all stages of carbohydrate metabolism. It provides a comprehensive overview of the energy generated from a single glucose molecule.
Glycolysis = 2 ATP: This is the net ATP directly produced by substrate-level phosphorylation during glycolysis.
NADH transport cost = – 2 ATP: This accounts for the energy expended to shuttle the cytoplasmic NADH into the mitochondria for the electron transport chain.
Pyruvate into Acetyl CoA = 0 ATP: This stage does not directly produce ATP through substrate-level phosphorylation. Its energy yield comes from the NADH produced.
Krebs cycle = 2 ATP: This is the net ATP (or GTP) directly produced by substrate-level phosphorylation in the Krebs cycle.
ETC = 34 ATP: This is the vast majority of ATP produced, generated through oxidative phosphorylation driven by the electron transport chain.
36 ATP per glucose: This is the final grand total of ATP molecules typically generated from the complete aerobic oxidation of one glucose molecule. This figure can vary slightly depending on the specific shuttle system used for cytosolic NADH.
Carbohydrate metabolism is a fundamental biochemical process that orchestrates the breakdown of carbohydrates, primarily glucose, to generate energy for cellular activities. This intricate journey involves a series of interconnected pathways: glycolysis, the conversion of pyruvate to acetyl CoA, the Krebs cycle, and the electron transport chain. Each stage plays a critical role in progressively extracting energy from glucose molecules and storing it in the form of adenosine triphosphate (ATP), the primary energy currency of the cell. Understanding these pathways is essential for comprehending how our bodies fuel everything from muscle contraction to complex neurological functions.
The process begins in the cytoplasm with glycolysis, an anaerobic pathway that breaks down a six-carbon glucose molecule into two three-carbon pyruvate molecules. Although glycolysis itself yields a modest net of 2 ATP and 2 NADH molecules, it sets the stage for the more substantial energy production that follows in the mitochondria. The pyruvate molecules then transition into the mitochondria, where they undergo an oxidative decarboxylation, transforming into acetyl CoA. This intermediate step is crucial as it links glycolysis to the aerobic machinery of the Krebs cycle, simultaneously generating more NADH and releasing carbon dioxide.
Subsequently, the acetyl CoA enters the Krebs cycle (also known as the citric acid cycle or TCA cycle) within the mitochondrial matrix. This cyclical pathway completely oxidizes the acetyl group, releasing the remaining carbon atoms as carbon dioxide and generating a significant number of high-energy electron carriers, specifically NADH and FADH2, along with a small amount of ATP through substrate-level phosphorylation. The grand finale of carbohydrate metabolism is the electron transport chain (ETC), located on the inner mitochondrial membrane. Here, the electrons carried by NADH and FADH2 are passed down a series of protein complexes, driving the pumping of protons and ultimately leading to the massive production of ATP through oxidative phosphorylation.
- Carbohydrate metabolism involves glycolysis, the Krebs cycle, and the electron transport chain.
- Glucose is the primary fuel source.
- ATP is the main energy product.
- The process occurs in both the cytoplasm and mitochondria.
The Interconnected Stages of Energy Production
The initial phase, glycolysis, does not require oxygen and takes place in the cell’s cytoplasm. During this ten-step process, a single molecule of glucose is split, resulting in the formation of two molecules of pyruvate. This stage yields a small, but immediate, energy return of 2 net ATP molecules through substrate-level phosphorylation, alongside 2 molecules of NADH, which carry high-energy electrons that will be utilized later. The efficiency of glycolysis ensures that even in oxygen-deprived environments, cells can generate a minimal amount of ATP to sustain basic functions.
Following glycolysis, if oxygen is present, pyruvate molecules are transported into the mitochondrial matrix. Here, each pyruvate undergoes an oxidative decarboxylation, converting into a two-carbon acetyl CoA molecule. This critical transition step releases carbon dioxide and generates another molecule of NADH for each pyruvate, meaning a total of 2 NADH molecules are produced per glucose. The acetyl CoA is now poised to enter the Krebs cycle, marking the full commitment to aerobic respiration and further energy extraction.
The Krebs cycle, occurring in the mitochondrial matrix, is a cyclical pathway that systematically processes the acetyl CoA. For each turn of the cycle (and two turns per glucose molecule), the acetyl group is completely oxidized, releasing two molecules of carbon dioxide. More importantly, this cycle generates a substantial number of electron carriers: 3 NADH and 1 FADH2 per acetyl CoA. Additionally, 1 ATP (or GTP, which is equivalent in energy) is produced directly through substrate-level phosphorylation per cycle. The primary role of the Krebs cycle is to load up the electron carriers with high-energy electrons for the final stage.
The electron transport chain, located on the inner mitochondrial membrane, is where the bulk of ATP is generated. The NADH and FADH2 molecules, produced from all prior stages, donate their high-energy electrons to a series of protein complexes. As these electrons are passed along, their energy is harnessed to pump protons (H+) from the mitochondrial matrix into the intermembrane space, creating a strong electrochemical gradient. This proton gradient then drives ATP synthase, an enzyme that acts as a molecular motor, to phosphorylate ADP into ATP. This process, known as oxidative phosphorylation, yields approximately 34 ATP molecules per glucose, making it the most significant contributor to cellular energy.
Clinical Relevance and Metabolic Disorders
Disruptions in carbohydrate metabolism can lead to a wide array of health issues, with diabetes mellitus being one of the most prevalent. Type 2 diabetes, for instance, involves insulin resistance, where cells do not respond effectively to insulin, impairing glucose uptake and utilization. This leads to elevated blood glucose levels, which can cause long-term damage to various organs if left unmanaged. Understanding the intricate balance of glycolysis, the Krebs cycle, and the electron transport chain is crucial for developing therapies that target specific metabolic points to restore glucose homeostasis.
Beyond diabetes, inherited metabolic disorders can also impact carbohydrate metabolism. For example, deficiencies in specific glycolytic enzymes, such as pyruvate kinase deficiency, can lead to hemolytic anemia due to the inability of red blood cells to produce sufficient ATP. Conversely, disorders affecting the mitochondrial machinery, such as defects in the Krebs cycle enzymes or electron transport chain complexes, can result in severe systemic issues, including neurological dysfunction, muscle weakness, and lactic acidosis. Detailed knowledge of these pathways is essential for diagnosis, prognosis, and the development of targeted interventions for patients suffering from such complex conditions.
Conclusion
The complete aerobic breakdown of glucose through glycolysis, the Krebs cycle, and the electron transport chain is a testament to the elegant efficiency of cellular metabolism. This coordinated series of reactions ensures a steady supply of ATP, the vital energy source that underpins all physiological functions. A thorough understanding of these pathways is not only foundational to biology but also critical for advancing medical treatments for a wide spectrum of metabolic disorders that arise when these intricate processes falter.

