An electrocardiogram (ECG) is a critical tool for identifying heart irregularities, revealing abnormalities that can indicate underlying cardiac conditions. This diagram illustrates common ECG abnormalities, including second-degree block, atrial fibrillation, ventricular tachycardia, ventricular fibrillation, and third-degree block, each with distinct patterns that correlate to specific electrical and mechanical dysfunctions. Exploring this image provides valuable insights into recognizing and understanding these cardiac irregularities.
Labelled Parts Explanation
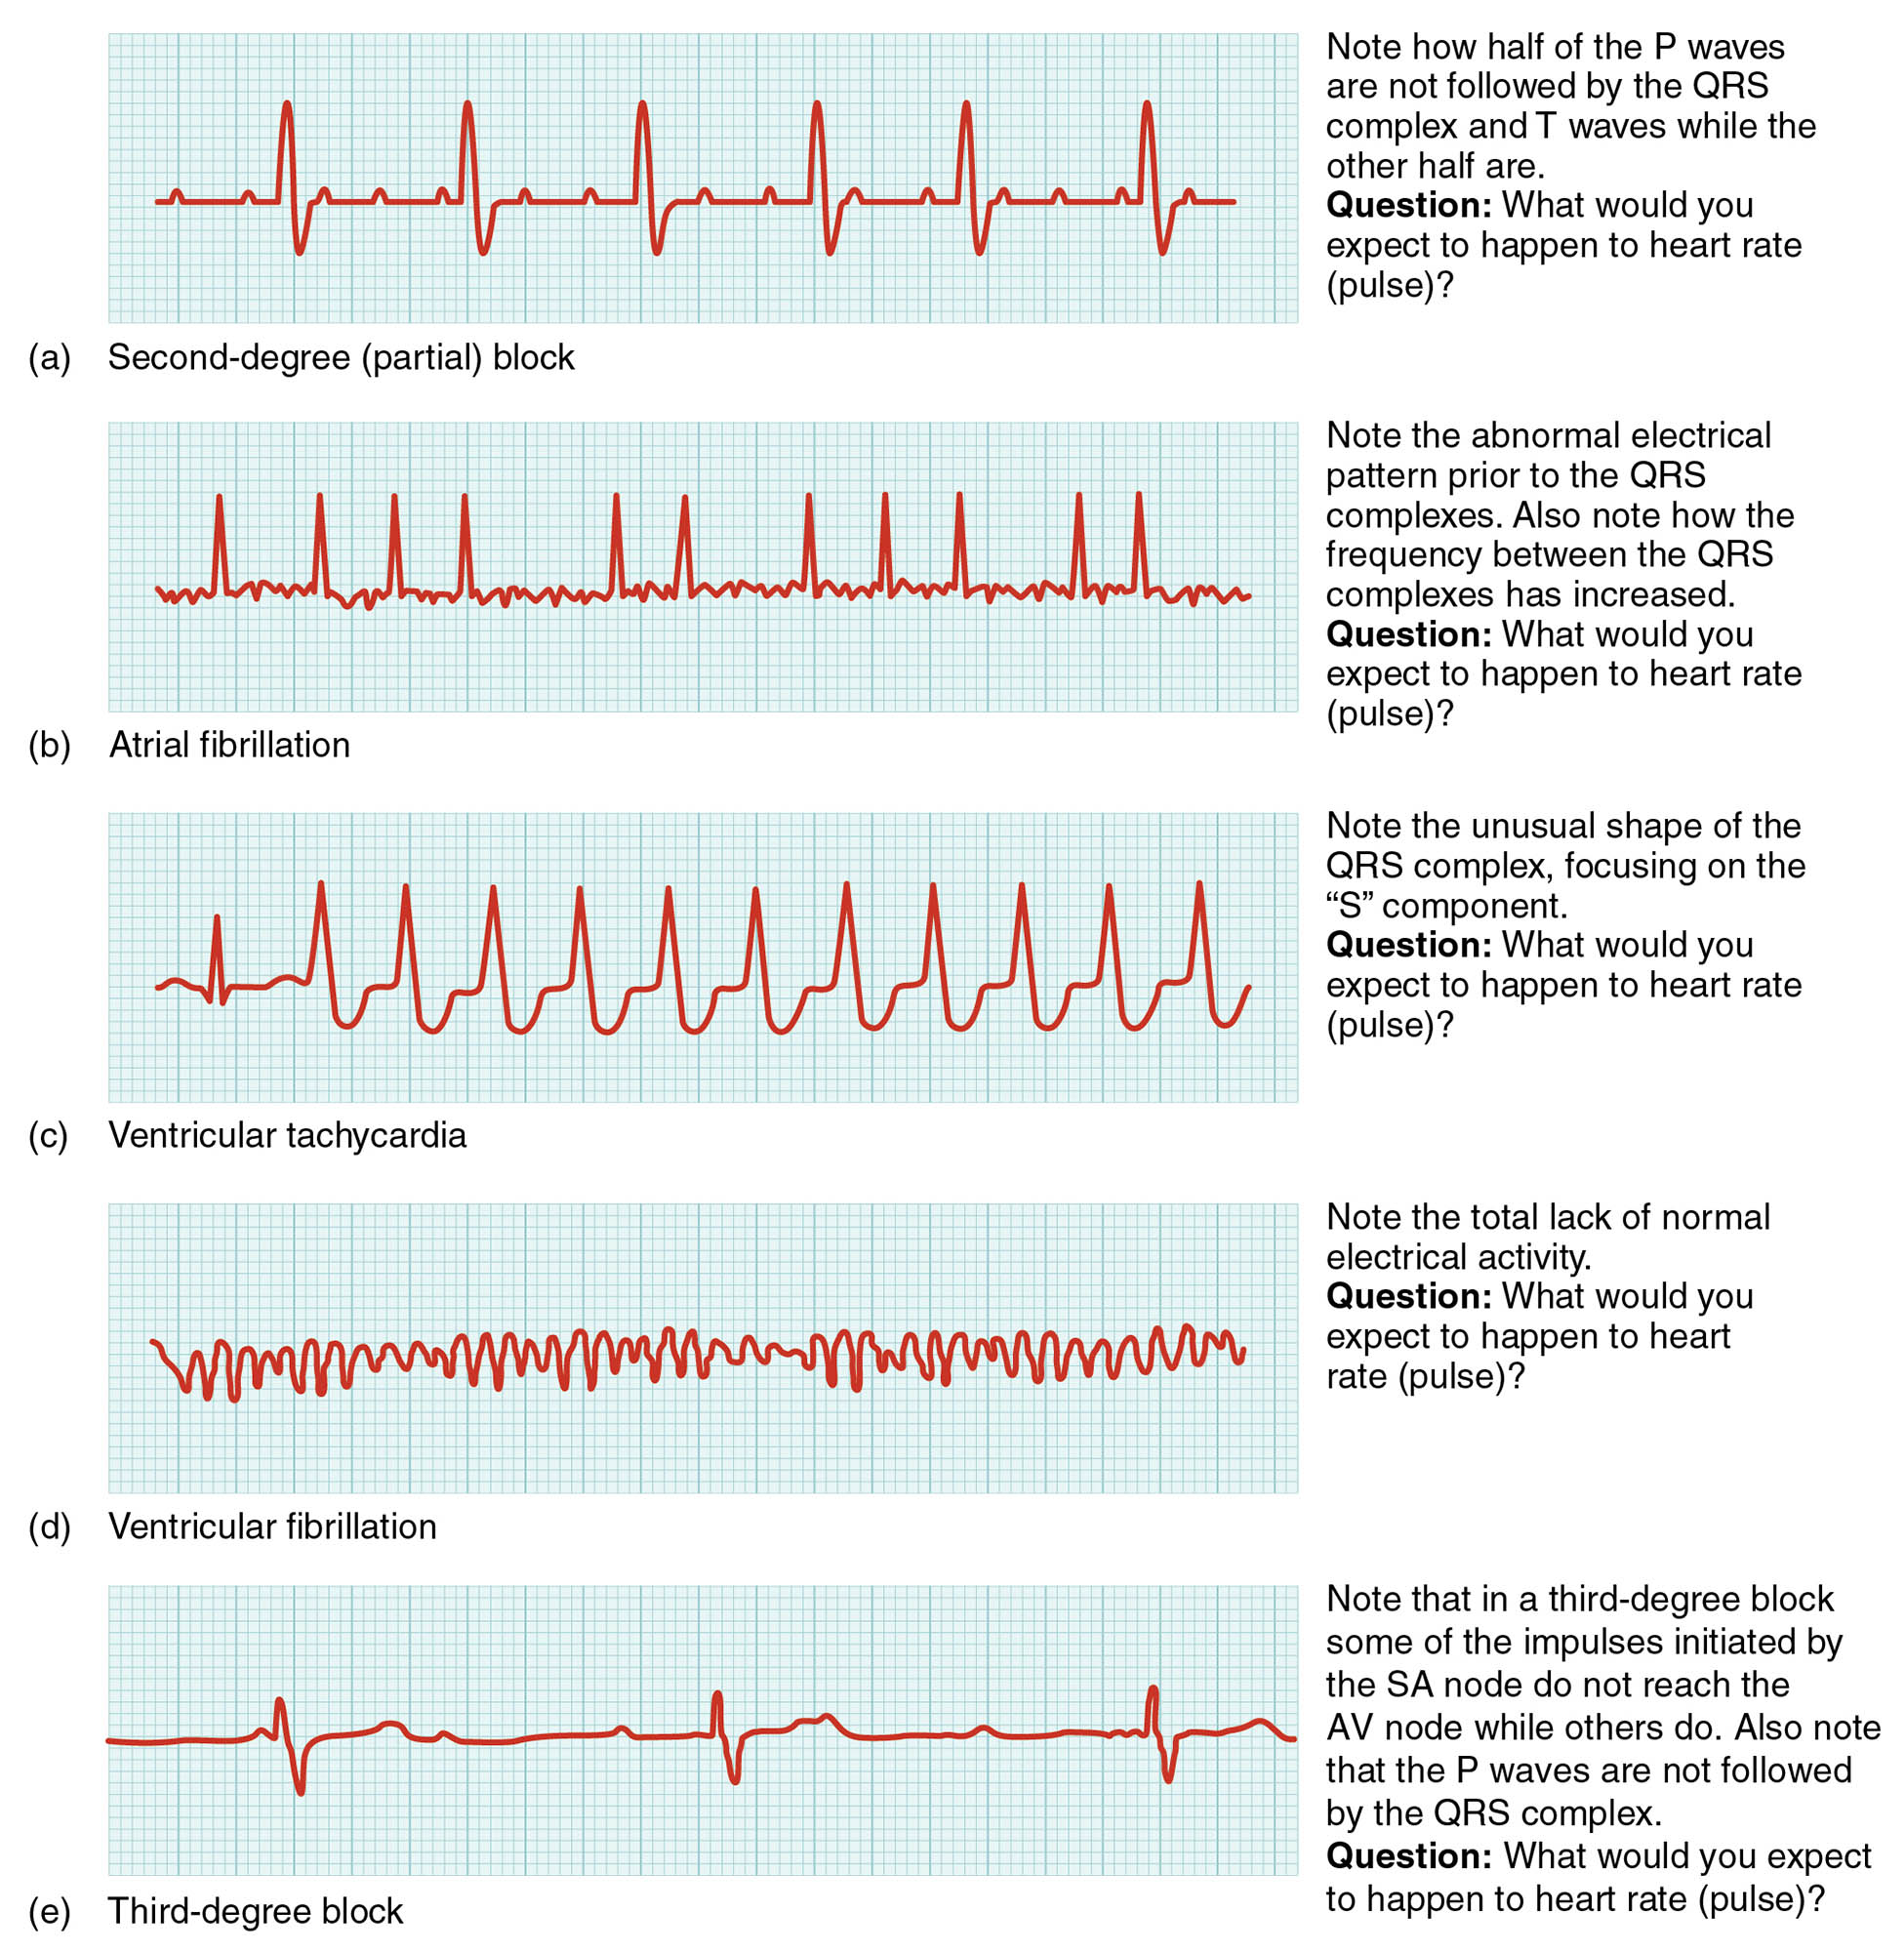
- Second-degree block The second-degree block shows a pattern where only some P waves are followed by QRS complexes and T waves, indicating partial atrioventricular conduction failure. This irregularity can lead to dropped beats, reducing cardiac output and requiring further evaluation.
- Atrial fibrillation The atrial fibrillation tracing displays irregular electrical activity before the QRS complex, with an increased frequency between complexes due to chaotic atrial impulses. This condition disrupts normal atrial contraction, potentially leading to inefficient blood flow and clot formation.
- Ventricular tachycardia The ventricular tachycardia pattern features abnormally shaped QRS complexes, resulting from rapid, irregular ventricular electrical activity. It poses a risk of deteriorating into more severe arrhythmias, necessitating immediate medical attention.
- Ventricular fibrillation The ventricular fibrillation tracing shows no recognizable electrical activity, characterized by chaotic, ineffective signals that prevent coordinated ventricular contraction. This life-threatening condition requires urgent defibrillation to restore normal rhythm.
- Third-degree block The third-degree block exhibits a complete dissociation between P waves and QRS complexes, indicating total atrioventricular block with independent atrial and ventricular activity. This severe conduction failure can lead to bradycardia and heart failure if untreated.
Anatomical Overview of ECG Abnormalities
The ECG abnormalities depicted in this diagram highlight deviations from the normal cardiac electrical pattern. Each condition reflects a disruption in the heart’s conduction system or rhythm.
- The second-degree block shows intermittent conduction failure between atria and ventricles.
- The atrial fibrillation reflects chaotic atrial electrical activity affecting rhythm.
- The ventricular tachycardia and ventricular fibrillation indicate dangerous ventricular irregularities.
- The third-degree block demonstrates complete electrical disconnection.
These patterns are essential for diagnosing cardiac dysfunction.
Characteristics of Second-Degree Block
Second-degree block is identified by its partial conduction pattern. Its ECG features provide diagnostic clues.
- The second-degree block often appears as a 2:1 or Mobitz type I/II pattern.
- Some P waves lack corresponding QRS complexes, indicating dropped beats.
- This can result from AV node disease or drug effects.
- Monitoring is crucial to assess progression to complete block.
This abnormality requires careful clinical correlation.
Features of Atrial Fibrillation
Atrial fibrillation is marked by irregular atrial activity. Its ECG tracing reveals specific changes.
- The atrial fibrillation shows no distinct P waves, replaced by fibrillatory waves.
- The increased QRS frequency reflects rapid, irregular ventricular response.
- This condition increases stroke risk due to atrial stasis.
- Rate control or anticoagulation may be indicated.
This rhythm disturbance demands targeted management.
Identification of Ventricular Tachycardia
Ventricular tachycardia is characterized by abnormal ventricular signals. Its ECG pattern signals urgency.
- The ventricular tachycardia displays wide, bizarre QRS complexes at a rapid rate.
- The abnormal shape results from ectopic ventricular foci.
- It can lead to hemodynamic instability or fibrillation.
- Immediate cardioversion is often required.
This condition is a medical emergency.
Understanding Ventricular Fibrillation
Ventricular fibrillation represents a complete loss of coordinated activity. Its ECG lacks normal waves.
- The ventricular fibrillation shows erratic, low-amplitude waves with no QRS or T waves.
- This chaotic activity fails to produce effective contraction.
- It is the primary cause of sudden cardiac death.
- Defibrillation is the only effective treatment.
This state requires rapid intervention.
Analysis of Third-Degree Block
Third-degree block indicates total conduction failure. Its ECG pattern shows clear dissociation.
- The third-degree block features regular but independent P waves and QRS complexes.
- The lack of correlation reflects complete AV node block.
- This can cause severe bradycardia or syncope.
- Pacemaker implantation is often necessary.
This condition requires urgent management.
Physiological Impact of ECG Abnormalities
These ECG abnormalities disrupt the heart’s normal electrical and mechanical function. Their effects influence circulation.
- The second-degree block reduces cardiac output due to missed beats.
- The atrial fibrillation impairs atrial contribution to ventricular filling.
- The ventricular tachycardia and ventricular fibrillation compromise pump efficiency.
- The third-degree block leads to asynchronous heart activity.
These changes can affect overall hemodynamic stability.
Clinical Relevance of ECG Abnormalities
Recognizing ECG abnormalities is vital for diagnosing and treating cardiac conditions. These patterns guide clinical decisions.
- The second-degree block may progress to third-degree block, requiring monitoring.
- The atrial fibrillation increases stroke risk, necessitating anticoagulation.
- The ventricular tachycardia and ventricular fibrillation demand emergency care.
- The third-degree block often leads to pacemaker therapy.
This understanding enhances patient outcomes.
Conclusion
The common ECG abnormalities diagram provides a detailed view of cardiac irregularities, including second-degree block, atrial fibrillation, ventricular tachycardia, ventricular fibrillation, and third-degree block, each with distinct ECG patterns reflecting electrical dysfunction. By exploring how these abnormalities correlate with heart conduction and mechanical issues, one gains insight into their impact on cardiac health. This understanding serves as a foundation for studying cardiovascular diagnostics and addressing related health concerns, encouraging further exploration of ECG analysis and its role in managing heart conditions.

