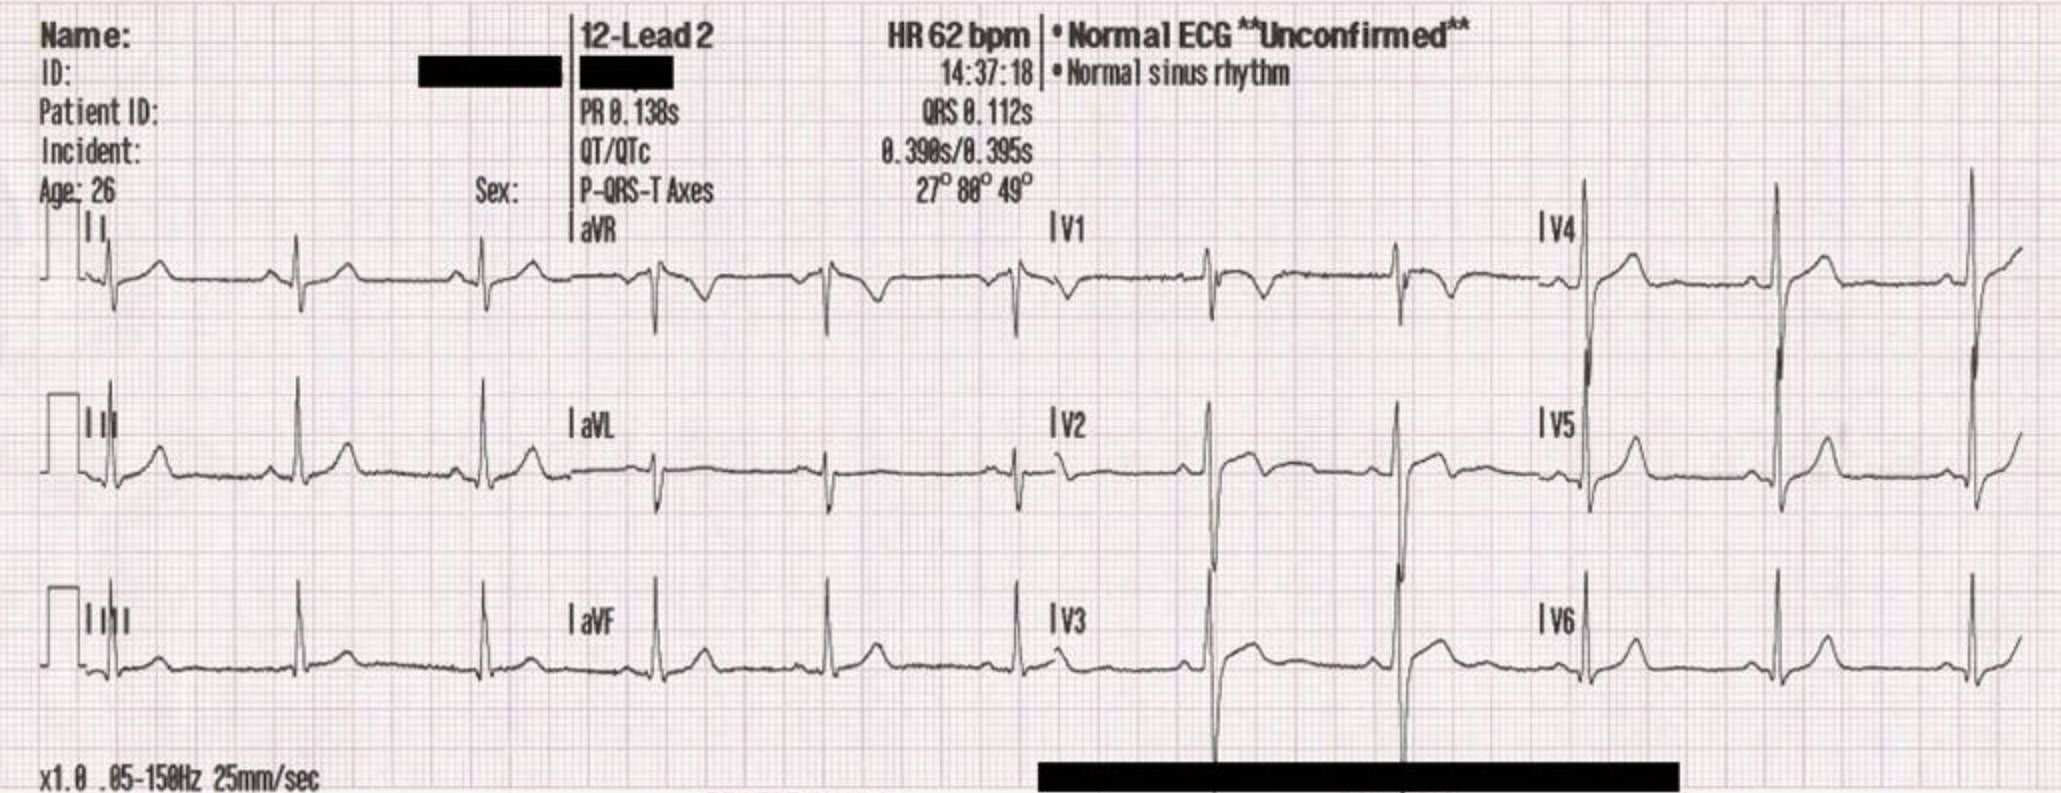
The 12-lead electrocardiogram (ECG) is the cornerstone of modern cardiac diagnostics, providing a comprehensive visual representation of the heart’s electrical activity. By analyzing the specific waveforms and intervals captured on the grid, healthcare professionals can assess the integrity of the cardiac conduction system, identify rhythm abnormalities, and rule out acute events such as heart attacks. The image provided illustrates a standard clinical report showing a “Normal Sinus Rhythm,” serving as a perfect baseline for understanding healthy cardiac physiology.
Leads I, II, and III:
These are the standard bipolar limb leads located in the first column on the left. They measure the electrical potential difference between the right arm, left arm, and left leg, forming “Einthoven’s Triangle” to determine the heart’s electrical axis in the frontal plane.
Leads aVR, aVL, and aVF:
Situated in the second column, these are the augmented unipolar limb leads. They view the heart’s electrical activity from specific reference points: the right shoulder (aVR), the left shoulder (aVL), and the feet (aVF), providing crucial vertical spatial information.
Leads V1–V6:
The waveforms displayed on the right side of the report are the precordial or chest leads. These unipolar leads are placed across the chest wall to provide a horizontal cross-section view of the heart, with V1 and V2 focusing on the right ventricle and septum, and V3 through V6 focusing on the left ventricle.
HR 62 bpm:
This value indicates the patient’s Heart Rate, calculated at 62 beats per minute. This falls well within the normal physiological range for an adult (60–100 bpm), confirming the presence of a resting rate without bradycardia or tachycardia.
PR 0.138s:
This measurement represents the PR interval, or the time it takes for the electrical impulse to travel from the sinus node through the atria to the ventricles. A value of 0.138 seconds is within the normal range (0.12–0.20 seconds), indicating efficient conduction through the AV node.
QRS 0.112s:
This value denotes the duration of the QRS complex, representing the time required for ventricular depolarization. A duration of 0.112 seconds is considered normal (typically under 0.12 seconds), suggesting there is no significant blockage in the bundle branches.
The Physiology of a Normal 12-Lead Trace
The 12-lead electrocardiogram is essentially a voltmeter that records the electrical currents generated by the heart muscle (myocardium) over time. In a healthy heart, as seen in the provided image, the rhythm originates in the sinoatrial (SA) node. This is the heart’s natural pacemaker. The electrical impulse generated here causes the atria to contract, pumping blood into the ventricles. On the ECG graph, this atrial activation is represented by the P-wave—a small, rounded upward deflection seen clearly in Lead II and V4-V6.
Following atrial contraction, the electrical signal reaches the atrioventricular (AV) node. Here, the signal is briefly delayed to allow the ventricles to fill completely with blood. This delay is represented by the flat line known as the PR segment. If this interval is too long, it suggests a heart block; if it is too short, it may indicate an accessory pathway such as in Wolff-Parkinson-White syndrome. In the specific case of the image provided, the automated calculation of 0.138 seconds confirms that the conduction from the atria to the ventricles is functioning perfectly.
The most prominent feature of the ECG is the QRS complex, which signifies ventricular depolarization. This is the electrical trigger for the main pumping action of the heart. Because the left ventricle is the largest and strongest chamber, it generates the most electricity, creating the tall spikes seen in the lateral leads (V4, V5, V6). Once the ventricles have contracted, they must “recharge” for the next beat. This recovery phase is called repolarization and creates the T-wave. A normal T-wave is upright and rounded. Inversions or flattening of this wave can be early signs of ischemia (lack of blood flow) or electrolyte imbalances.
- Key components analyzed in a 12-lead ECG include:
- Rhythm: Checking for regularity between R-waves (heartbeats).
- Rate: Ensuring the pulse is between 60 and 100 beats per minute.
- Axis: Determining the general direction of electrical flow through the heart.
- Morphology: Examining the shape of the ST segment to rule out myocardial infarction.
Clinical Significance of “Normal Sinus Rhythm”
The term “Normal Sinus Rhythm” (NSR) appearing on the report is the medical benchmark for a healthy cardiac cycle. It implies three critical physiological facts: the impulse is starting at the correct location (the sinoatrial node), the rate is appropriate for a resting state, and the conduction pathway is intact. The computerized interpretation labeled “Unconfirmed” is a standard safety feature on all modern ECG machines. While the device’s algorithms are highly accurate at measuring intervals and calculating axes, a trained physician must visually verify the waveforms to ensure that artifacts (muscle tremors or loose electrodes) haven’t been mistaken for cardiac pathology.
In the provided image, we see a clean baseline with no “noise,” meaning the electrodes had good contact with the skin. The ST segments are isoelectric (flat), which is a vital negative finding; elevated ST segments are the hallmark of an acute heart attack (STEMI). Furthermore, the QT interval (corrected as QTc) is within safe limits. A prolonged QT interval can be a side effect of certain medications or genetic conditions and places patients at risk for dangerous arrhythmias like Torsades de Pointes. Therefore, confirming a normal ECG is as clinically significant as diagnosing an abnormal one, as it effectively rules out active electrical or structural crises.
Conclusion
The 12-lead ECG remains an indispensable tool in clinical medicine, bridging the gap between electrical physics and human physiology. The report displayed demonstrates the precise orchestration of the cardiac cycle, from the initial atrial spark to the final ventricular recovery. By systematically evaluating the leads, intervals, and axes, clinicians can confirm the health of the conduction system or pinpoint specific areas of dysfunction. Understanding these normal values is the essential first step in recognizing and treating cardiovascular disease.

