The electrical axis of the heart is a fundamental diagnostic parameter in electrocardiography that describes the average direction of electrical depolarization as it spreads through the ventricles. By examining the morphology and polarity of the QRS complex in standard limb leads I, II, and III, healthcare providers can determine the mean electrical vector of the heart. Accurately identifying whether a patient has a normal axis or a specific deviation is critical for diagnosing underlying conditions such as ventricular hypertrophy, conduction blocks, or myocardial infarction.
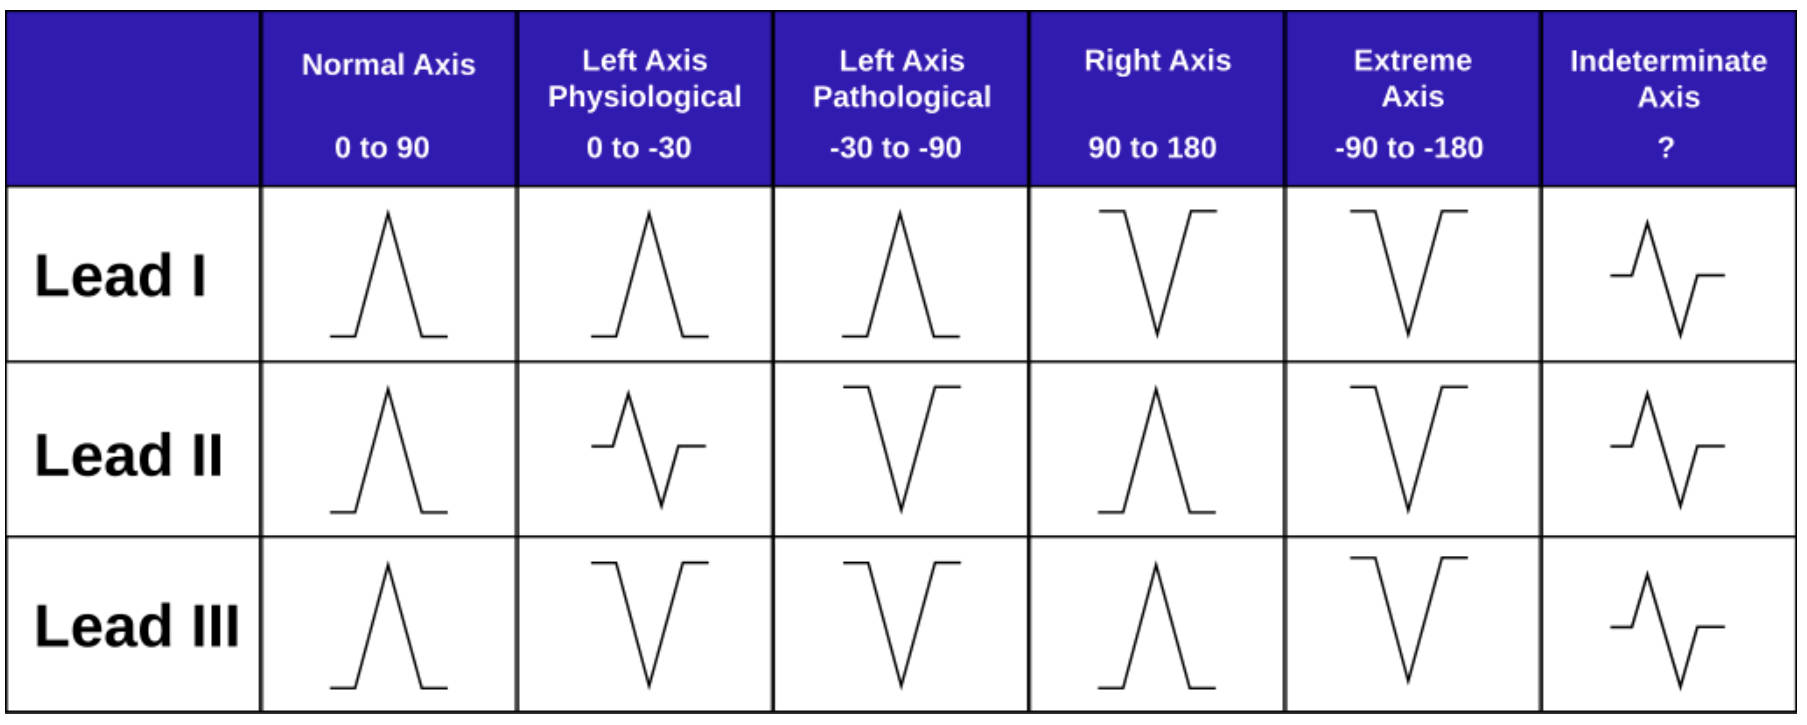
Normal Axis (0 to 90): This column represents the standard electrical flow in a healthy heart, moving downward and to the left. On the ECG tracing, the QRS complex appears predominantly positive (upright) in Lead I, Lead II, and Lead III, indicating that the depolarization wave is moving towards these positive electrodes.
Left Axis Physiological (0 to -30): This range indicates a slight shift of the electrical vector to the left, which can be a normal variant in some individuals or associated with minor anatomical changes. In this scenario, Lead I remains positive, while Lead II may show an equiphasic (equal upward and downward deflection) or slightly negative complex, and Lead III becomes negative.
Left Axis Pathological (-30 to -90): Often referred to as true Left Axis Deviation (LAD), this pattern signifies a significant shift in the electrical vector that usually implies underlying disease. The ECG shows a strongly positive complex in Lead I, but a deep negative deflection in both Lead II and Lead III, differentiating it from the physiological variant.
Right Axis (90 to 180): This deviation occurs when the mean electrical vector points further to the right than normal, often due to right ventricular strain or hypertrophy. In this pattern, Lead I displays a negative QRS complex, while Lead II and Lead III show positive deflections, creating a visual effect where the complexes in Leads I and II point toward each other.
Extreme Axis (-90 to -180): Also known as “Northwest Axis” or “No Man’s Land,” this rare finding indicates that the electrical impulse is traveling in the completely opposite direction of normal flow. The QRS complexes are predominantly negative in Lead I, Lead II, and Lead III, suggesting severe conduction pathology or a ventricular origin of the rhythm.
Indeterminate Axis (?): This category describes a situation where the mean electrical axis cannot be confidently calculated, often due to the heart’s electrical forces being perpendicular to the frontal plane. The tracings typically show equiphasic or low-voltage complexes across Leads I, II, and III, making it difficult to assign a specific vector direction.
The Physiology of the Hexaxial Reference System
The concept of the cardiac axis is derived from the Hexaxial Reference System, which divides the frontal plane of the body into a 360-degree circle. The heart’s electrical activity begins at the sinoatrial (SA) node and spreads through the atria to the atrioventricular (AV) node, eventually depolarizing the ventricles. Because the left ventricle is significantly larger and more muscular than the right, the net electrical force typically points downward and to the patient’s left, landing in the “Normal Axis” quadrant between 0 and +90 degrees.
When reading an Electrocardiogram, clinicians use the limb leads (I, II, and III) as “cameras” looking at the heart from different angles. Lead I looks from the left shoulder, Lead II from the left foot, and Lead III from the right foot. If the electricity travels towards a lead, the tracing goes up; if it travels away, the tracing goes down. By comparing these three views, as shown in the diagram, one can triangulate the exact direction of the depolarization wave. This geometric analysis is essential because changes in the axis often precede other visible signs of cardiac disease.
Several factors can physically or electrically rotate the heart’s axis. Physical factors include pregnancy or obesity, which push the diaphragm up and shift the heart horizontally (causing a leftward shift). Electrical factors involve the conduction system; for instance, a block in one of the fascicles (pathways) of the bundle branches forces the electricity to take a detour, altering the average vector.
Key causes of axis deviation include:
- Ventricular Hypertrophy: An enlarged muscle mass pulls the electrical signal toward it (e.g., Left Ventricular Hypertrophy causes LAD).
- Myocardial Infarction: Dead tissue does not conduct electricity, so the vector moves away from the infarcted area.
- Conduction Defects: Conditions like Left Anterior Fascicular Block (LAFB) or Left Posterior Fascicular Block (LPFB).
- Pulmonary Conditions: Chronic obstructive pulmonary disease (COPD) or pulmonary embolisms can strain the right heart, causing Right Axis Deviation.
Clinical Implications of Axis Deviation
Distinguishing between physiological and pathological Left Axis Deviation (LAD) is a vital skill. Physiological LAD (0 to -30 degrees) is generally benign and can occur due to age or body habitus. However, Pathological LAD (-30 to -90 degrees) is a strong indicator of left ventricular involvement. This is frequently caused by Left Anterior Fascicular Block (LAFB), a condition where the anterior portion of the left bundle branch fails to conduct. Consequently, the impulse must travel through the posterior fascicle, delaying activation of the anterior wall and shifting the vector sharply to the left. Pathological LAD is also a hallmark of Ventricular Hypertrophy, specifically of the left ventricle, where the increased muscle mass generates a stronger electrical voltage directed leftward.
Right Axis Deviation (RAD) requires an equally thorough investigation. While it can be normal in children and tall, thin adults (whose hearts hang vertically), a new onset of RAD in an adult is concerning. It typically suggests right ventricular overload. This can be acute, such as in a massive pulmonary embolism where a clot blocks blood flow to the lungs, causing sudden strain on the right ventricle. Alternatively, it can be chronic, seen in severe lung diseases or congenital heart defects. In the context of the diagram provided, recognizing the pattern of a negative Lead I and positive Lead III allows for rapid identification of this potential right-sided strain.
Conclusion
Understanding the variations in QRS morphology across Leads I, II, and III is indispensable for accurate cardiac assessment. The chart serves as a quick reference guide, translating complex vector physics into recognizable visual patterns. By systematically categorizing the axis as normal, physiological, pathological, right, or extreme, medical professionals can narrow down differential diagnoses and initiate appropriate interventions. Whether it signals benign anatomical positioning or serious conduction pathology, the cardiac axis remains a cornerstone of ECG interpretation.

