The electrocardiogram (ECG or EKG) is the gold standard for non-invasive cardiac monitoring, providing a graphic representation of the heart’s electrical activity over time. Each heartbeat generates a specific series of electrical waves and intervals—known as the PQRSTU complex—that correspond to distinct mechanical events within the cardiac cycle. Mastering the morphology and duration of these components is essential for clinicians to accurately diagnose arrhythmias, conduction blocks, and myocardial ischemia.
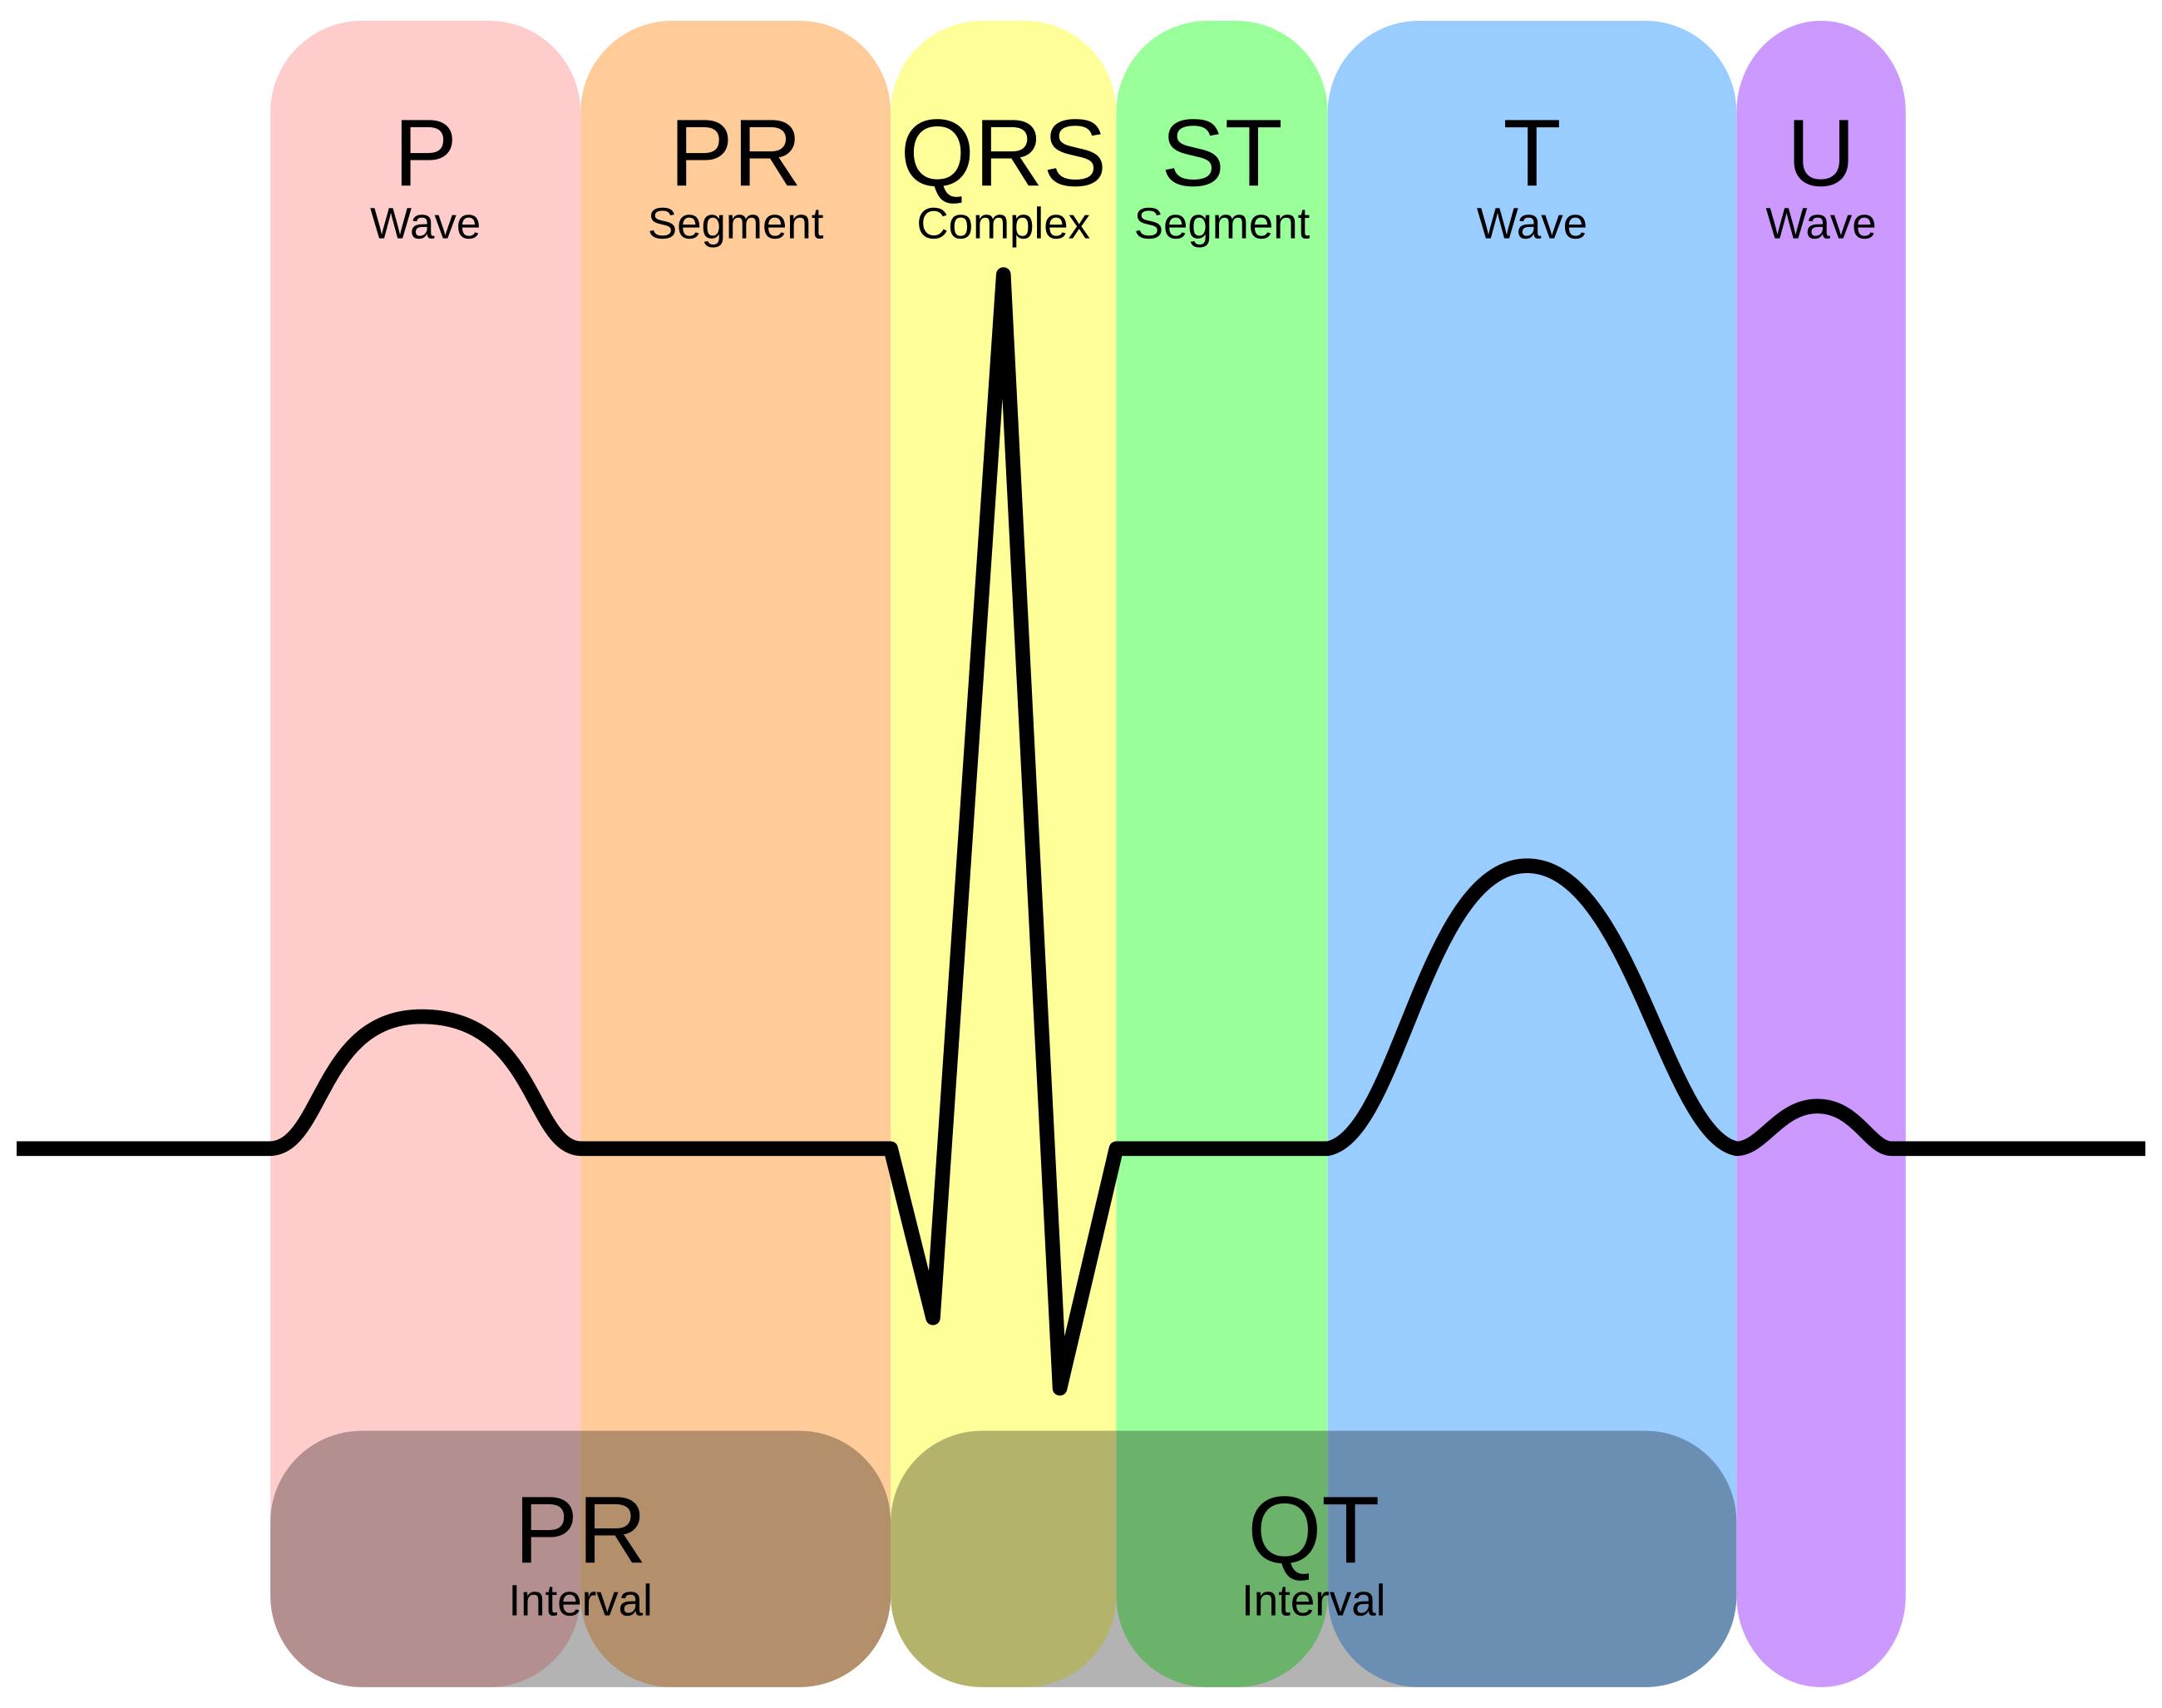
P Wave: This positive deflection represents atrial depolarization, the initial electrical activation of the atria that originates from the sinoatrial (SA) node. It indicates that the electrical impulse is spreading across the right and left atria, triggering atrial contraction and pushing blood into the ventricles.
PR Segment: This is the flat, isoelectric line found between the end of the P wave and the beginning of the QRS complex. It represents the physiological delay of the electrical impulse at the atrioventricular (AV) node, which allows time for the ventricles to fill completely with blood before they contract.
QRS Complex: This prominent waveform reflects ventricular depolarization, the spread of electrical activity through the Bundle of His, bundle branches, and Purkinje fibers. Because the ventricular muscle mass is much larger than that of the atria, the QRS complex has a significantly higher amplitude, effectively masking the simultaneous repolarization of the atria.
ST Segment: This section spans from the end of the S wave (the J-point) to the beginning of the T wave and represents the early phase of ventricular repolarization. In a healthy heart, this segment should be isoelectric (flat) relative to the baseline; significant elevation or depression here is a hallmark sign of myocardial injury or ischemia.
T Wave: This wave represents the rapid phase of ventricular repolarization, where the ventricular myocytes recover their resting electrical state to prepare for the next beat. The T wave is typically upright and asymmetrical, and its morphology can be altered by electrolyte imbalances, such as hyperkalemia, or cardiac ischemia.
U Wave: This is a small, often unseen positive deflection that follows the T wave, thought to represent the repolarization of the interventricular septum or the Purkinje fibers. While prominent U waves can be a normal variant in athletes, they are frequently associated with hypokalemia (low potassium levels) or specific drug toxicities.
PR Interval: This interval is measured from the onset of the P wave to the onset of the QRS complex, encompassing atrial depolarization and the conduction delay through the AV node. A normal PR interval ranges between 0.12 and 0.20 seconds; prolongation suggests a conduction block, while a shortened interval may indicate pre-excitation syndromes.
QT Interval: This measurement extends from the beginning of the QRS complex to the end of the T wave, representing the total duration of ventricular depolarization and repolarization. The length of the QT interval varies with heart rate, and distinct prolongation is a significant risk factor for developing life-threatening ventricular arrhythmias like Torsades de Pointes.
The Physiology Behind the Cardiac Cycle
The electrocardiogram is a fundamental diagnostic tool that translates the electrophysiology of the heart into a visual format. The heart functions as a dual-pump system driven by an intrinsic electrical conduction network. This network ensures that the heart chambers contract in a synchronized manner—first the atria, then the ventricles—to maximize hemodynamic efficiency. The image provided illustrates a single cardiac cycle, breaking it down into specific electrical events that can be measured in milliseconds. The precise timing of these events is governed by the movement of ions, specifically sodium, potassium, and calcium, across the cell membranes of cardiac myocytes.
When interpreting an ECG, medical professionals look for consistency in the shape, duration, and spacing of these waves. The horizontal axis of the graph represents time, while the vertical axis represents voltage or amplitude. A normal sinus rhythm is characterized by a repetitive pattern where every P wave is followed by a QRS complex at a regular rate. Deviations from this standard pattern allow providers to identify underlying pathologies ranging from benign palpitations to life-threatening conditions.
Key components analyzed during ECG interpretation include:
-
Rate and Rhythm: Determining if the heart beats too fast (tachycardia), too slow (bradycardia), or irregularly.
-
Conduction Intervals: Measuring the PR and QT intervals to assess the speed of electrical transmission.
-
Axis and Hypertrophy: Evaluating the direction of electrical flow and the size of the heart chambers.
-
Ischemic Changes: Analyzing the ST segment and T wave for signs of oxygen deprivation or tissue death.
Electrophysiology and Waveform Mechanics
The mechanics of the ECG are rooted in the concept of depolarization and repolarization. Depolarization is the electrical trigger for muscle contraction (systole). As seen in the diagram, the P wave and QRS complex are depolarization events. The P wave corresponds to the electrical activation of the upper chambers (atria), while the sharp, high-voltage QRS complex corresponds to the activation of the lower, more muscular chambers (ventricles). The magnitude of the QRS is much larger than the P wave simply because there is more muscle mass in the ventricles generating a stronger electrical signal.
Following contraction, the heart muscle must reset electrically to beat again; this process is called repolarization (diastole). The ST segment and T wave represent this recovery phase for the ventricles. The ST segment is unique because it represents a plateau phase where the heart muscle maintains contraction before relaxing. This period is metabolically demanding, which is why the ST segment is the most sensitive indicator of myocardial ischemia. If the coronary arteries cannot supply enough oxygen during this phase, the ion channels malfunction, causing the ST segment to shift above or below the baseline.
The intervals marked in the image, such as the QT interval, are critical for assessing electrical stability. The QT interval represents the entire electrical systole of the ventricles. If this interval becomes prolonged—whether due to genetics, medication side effects, or electrolyte imbalances—the heart becomes vulnerable to “after-depolarizations.” These are abnormal electrical sparks that can trigger chaotic rhythms, leading to sudden cardiac arrest. Therefore, precise measurement of these intervals is not just an academic exercise but a vital safety assessment in clinical pharmacology and emergency medicine.
Clinical Application and Summary
Ultimately, the standard ECG complex serves as a vital roadmap of cardiac health. By understanding the distinct phases—from the atrial kick indicated by the P wave to the ventricular recovery seen in the T wave—healthcare providers can infer the mechanical state of the heart. For instance, a widened QRS complex suggests that the electrical signal is taking a detour through the heart muscle rather than using the fast-conducting specialized pathways, often indicating a bundle branch block or ventricular pacemaker rhythm.
In conclusion, the annotated ECG diagram highlights the intricate synchronization required for effective cardiac output. Each labeled segment, wave, and interval provides specific data points regarding the health of the conduction system and the myocardium. Recognizing the normal parameters of the electrocardiogram allows for the rapid identification of abnormalities, facilitating timely interventions that can preserve heart function and save lives.

