This historical photograph illustrates a pivotal moment in the evolution of cardiology, depicting an early commercial electrocardiograph manufactured by the Cambridge Scientific Instrument Company around 1911. Based on the groundbreaking standards established by Willem Einthoven, this massive apparatus represents the transition of cardiac monitoring from experimental physics laboratories to clinical application. The image displays a subject with limbs immersed in saline solution, a primitive yet effective method for conducting the heart’s electrical signals to the string galvanometer, laying the foundational principles for the modern 12-lead ECG used in hospitals today.
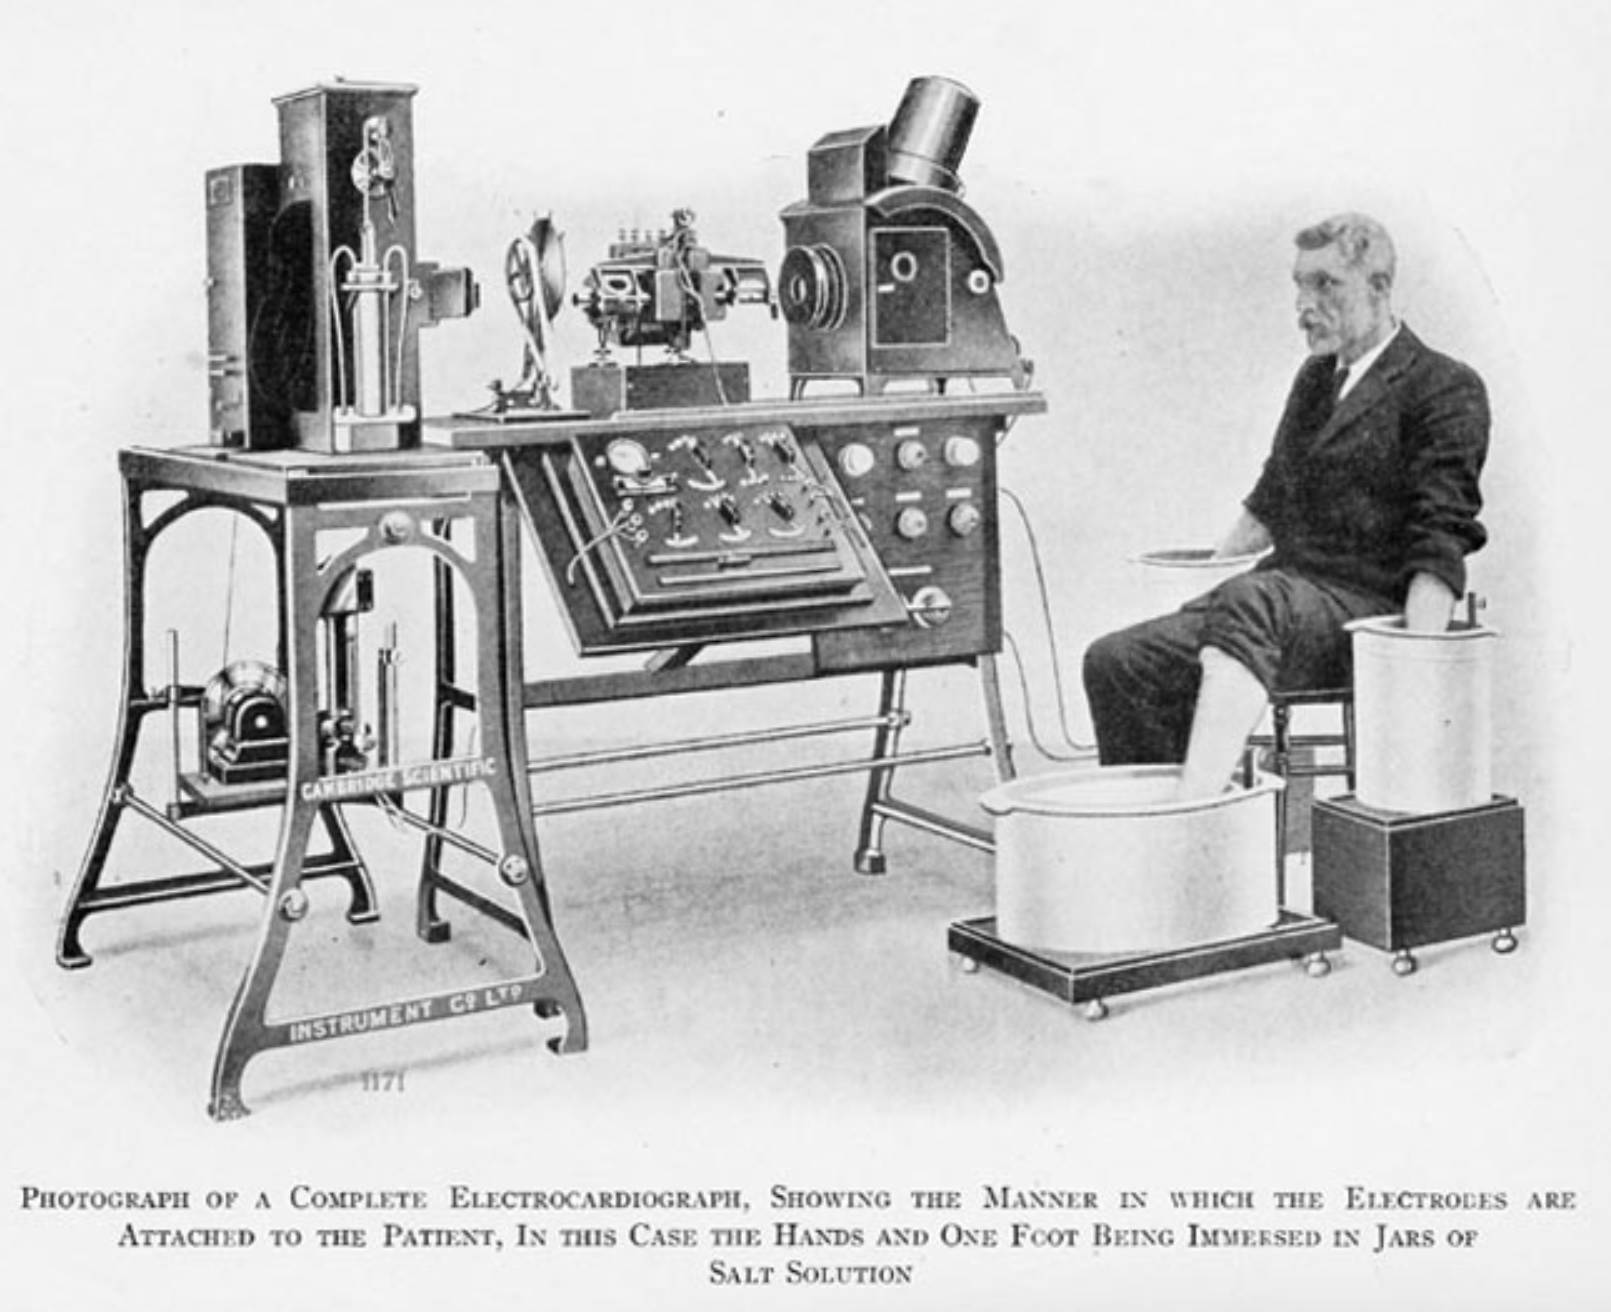
Saline Immersion Cylinders: These large vessels, filled with a conductive salt solution, served as the earliest form of ECG electrodes. By immersing the patient’s hands and left foot into the brine, the solution lowered the electrical resistance of the skin, creating a stable connection to transmit the faint electrical currents from the body to the recording machine.
String Galvanometer Assembly: The substantial equipment located on the table and stand represents the core of the diagnostic system, known as the string galvanometer. This device utilized a microscopically thin conductive filament suspended in a powerful magnetic field, which would vibrate in response to the electrical currents generated by the patient’s heartbeat.
Photographic Recording System: Positioned behind the galvanometer, this component consisted of an arc light and a moving photographic plate or film. Because the movement of the string was too subtle to be seen by the naked eye or driven by a mechanical pen, the machine projected the shadow of the vibrating string onto light-sensitive paper to create the visual waveform.
The Dawn of Electrical Cardiac Monitoring
The image captures a fascinating era in medical technology where physics and physiology began to merge. While Willem Einthoven is credited with inventing the string galvanometer in the early 20th century, the machine pictured here is a refined commercial version produced by the Cambridge Scientific Instrument Company. Unlike the compact, digital devices used today, these early machines were cumbersome, weighing several hundred pounds and requiring a dedicated room and a team of operators. However, they provided the first accurate, non-invasive window into the electrical activity of the living human heart.
The setup shown demonstrates the practical application of “Einthoven’s Triangle.” By placing electrodes (in this case, saline buckets) on the right arm, left arm, and left leg, physicians could calculate the electrical axis of the heart. This configuration allowed for the derivation of three standard leads (Lead I, Lead II, and Lead III), which remain the basis of standard electrocardiography. The capability to record these signals meant that for the first time, doctors could visually identify arrhythmias, conduction blocks, and signs of cardiac hypertrophy without surgery.
Despite its primitive appearance, the fidelity of the recordings produced by these machines was remarkably high. The string galvanometer was sensitive enough to detect microvolts of electricity, capturing the distinct waveforms that Einthoven named P, Q, R, S, and T. These designations are still used universally to describe the cardiac cycle. This era marked the shift from listening to the heart (auscultation) to analyzing its electrical properties, fundamentally changing how heart disease was diagnosed and understood.
- Key features of early electrocardiography included:
- The use of electrolyte-rich saline baths to overcome high skin impedance.
- Reliance on a string galvanometer to detect minute bio-electrical currents.
- Photographic processing required to view the final diagnostic tracing.
- Strict patient immobility to prevent motion artifacts from distorting the signal.
Physiology of the Electrocardiogram
To understand what this machine is recording, one must understand the heart’s internal electrical system. The heart is not merely a muscle; it is an electromechanical pump controlled by specialized tissue that generates and conducts electrical impulses. The cardiac cycle begins at the sinoatrial node, often called the heart’s natural pacemaker, located in the right atrium. This node spontaneously generates an electrical impulse that spreads across the atria, causing them to contract and push blood into the ventricles. On an ECG recording, this depolarization of the atria is represented by the P-wave.
Following atrial contraction, the electrical signal reaches the atrioventricular (AV) node, where it pauses briefly. This delay is crucial as it allows the ventricles to fill completely with blood. The impulse then shoots down the Bundle of His and splits into the right and left bundle branches, finally dispersing through the Purkinje fibers. This rapid transmission causes the large ventricular muscles to depolarize and contract forcefully, pumping blood to the lungs and the rest of the body. This significant electrical event creates the QRS complex, the most prominent spike seen on the ECG.
The final phase of the cycle involves the repolarization, or “recharging,” of the ventricles, preparing them for the next beat. This is represented by the T-wave. The machine in the photograph was designed to detect the vector (direction and magnitude) of these ionic currents as they radiate from the heart to the skin. By analyzing the timing and shape of these waves, clinicians can diagnose conditions such as myocardial infarction (heart attack), where dying tissue fails to conduct electricity properly, or atrial fibrillation, where the P-wave disappears due to chaotic atrial activity.
Conclusion
The Cambridge Scientific Instrument Company’s electrocardiograph stands as a monument to medical ingenuity. It serves as a reminder that the sleek, portable telemetry units and smartwatches of the 21st century share a direct lineage with these room-sized giants and buckets of salt water. By successfully translating the biological principles of cardiac conduction into a visual format, these early devices established the rigorous standards of diagnostic cardiology, saving countless lives by making the invisible electrical rhythms of the heart visible to the physician’s eye.

