The Holter monitor is a pivotal diagnostic tool in modern cardiology, designed to record the heart’s electrical activity continuously for 24 to 48 hours or longer. Unlike a standard electrocardiogram (ECG), which provides only a brief snapshot of cardiac function, this portable device captures a continuous “movie” of the heart’s rhythm while the patient engages in their normal daily activities. By analyzing this extended data, physicians can detect intermittent irregularities that often go unnoticed during a short office visit, providing a definitive diagnosis for various heart conditions.
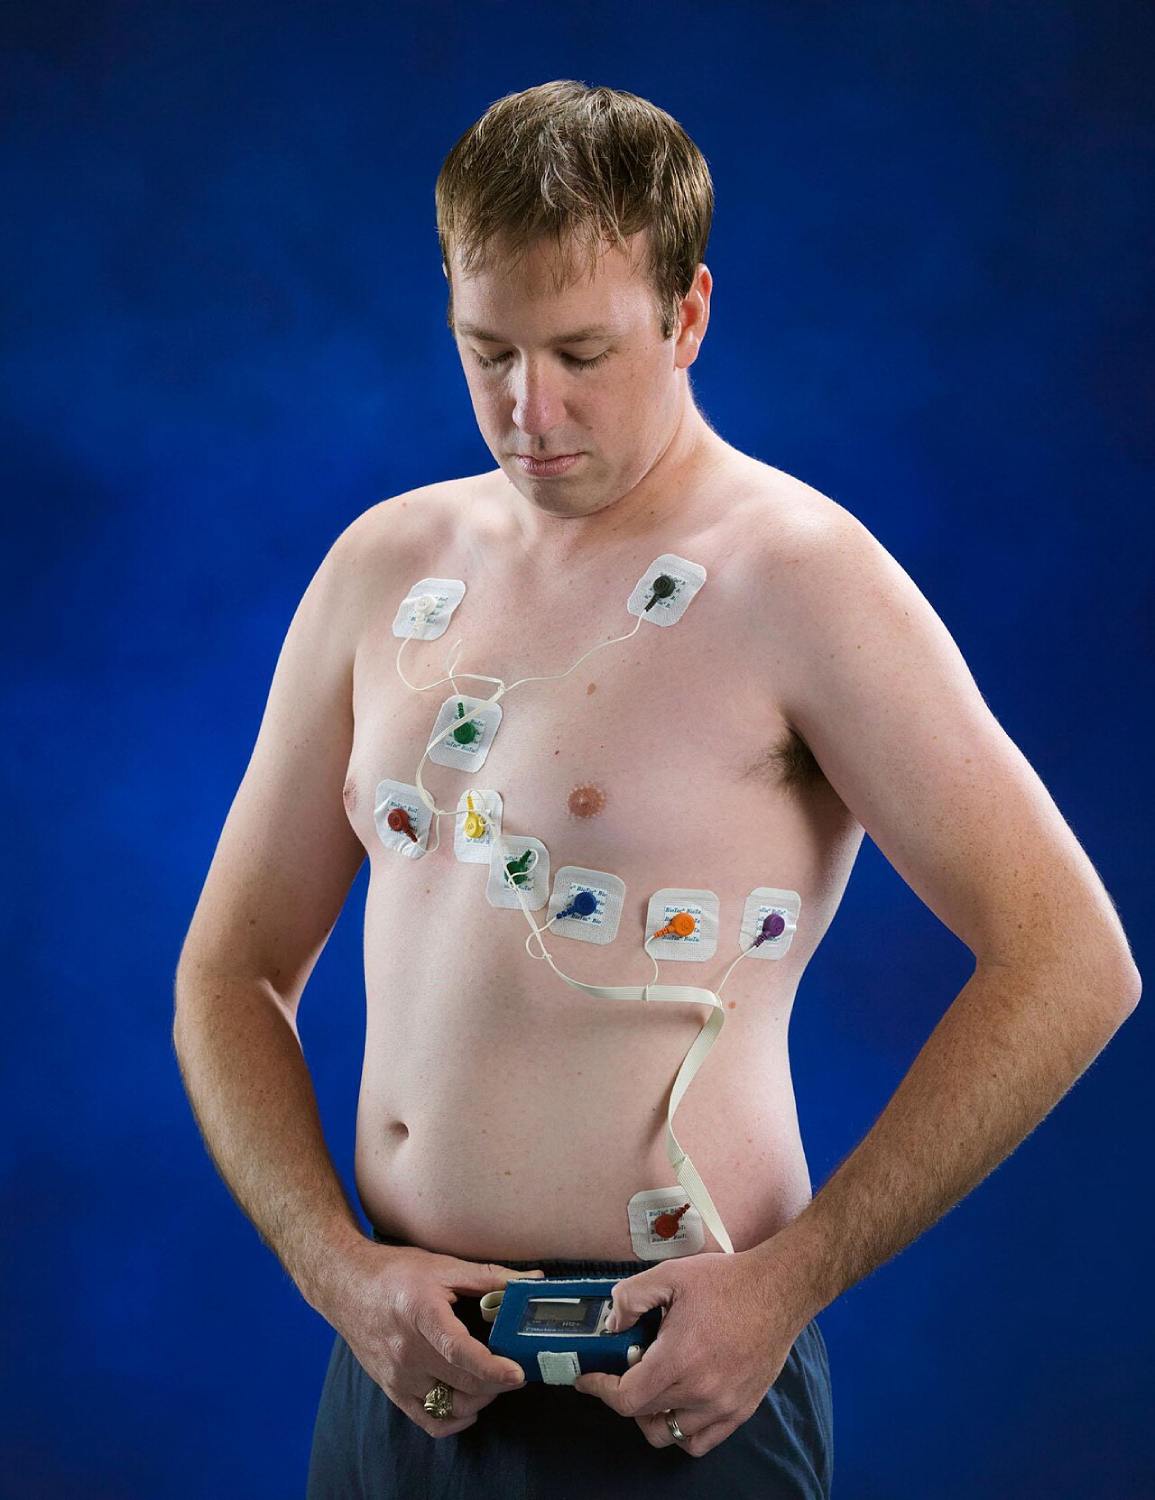
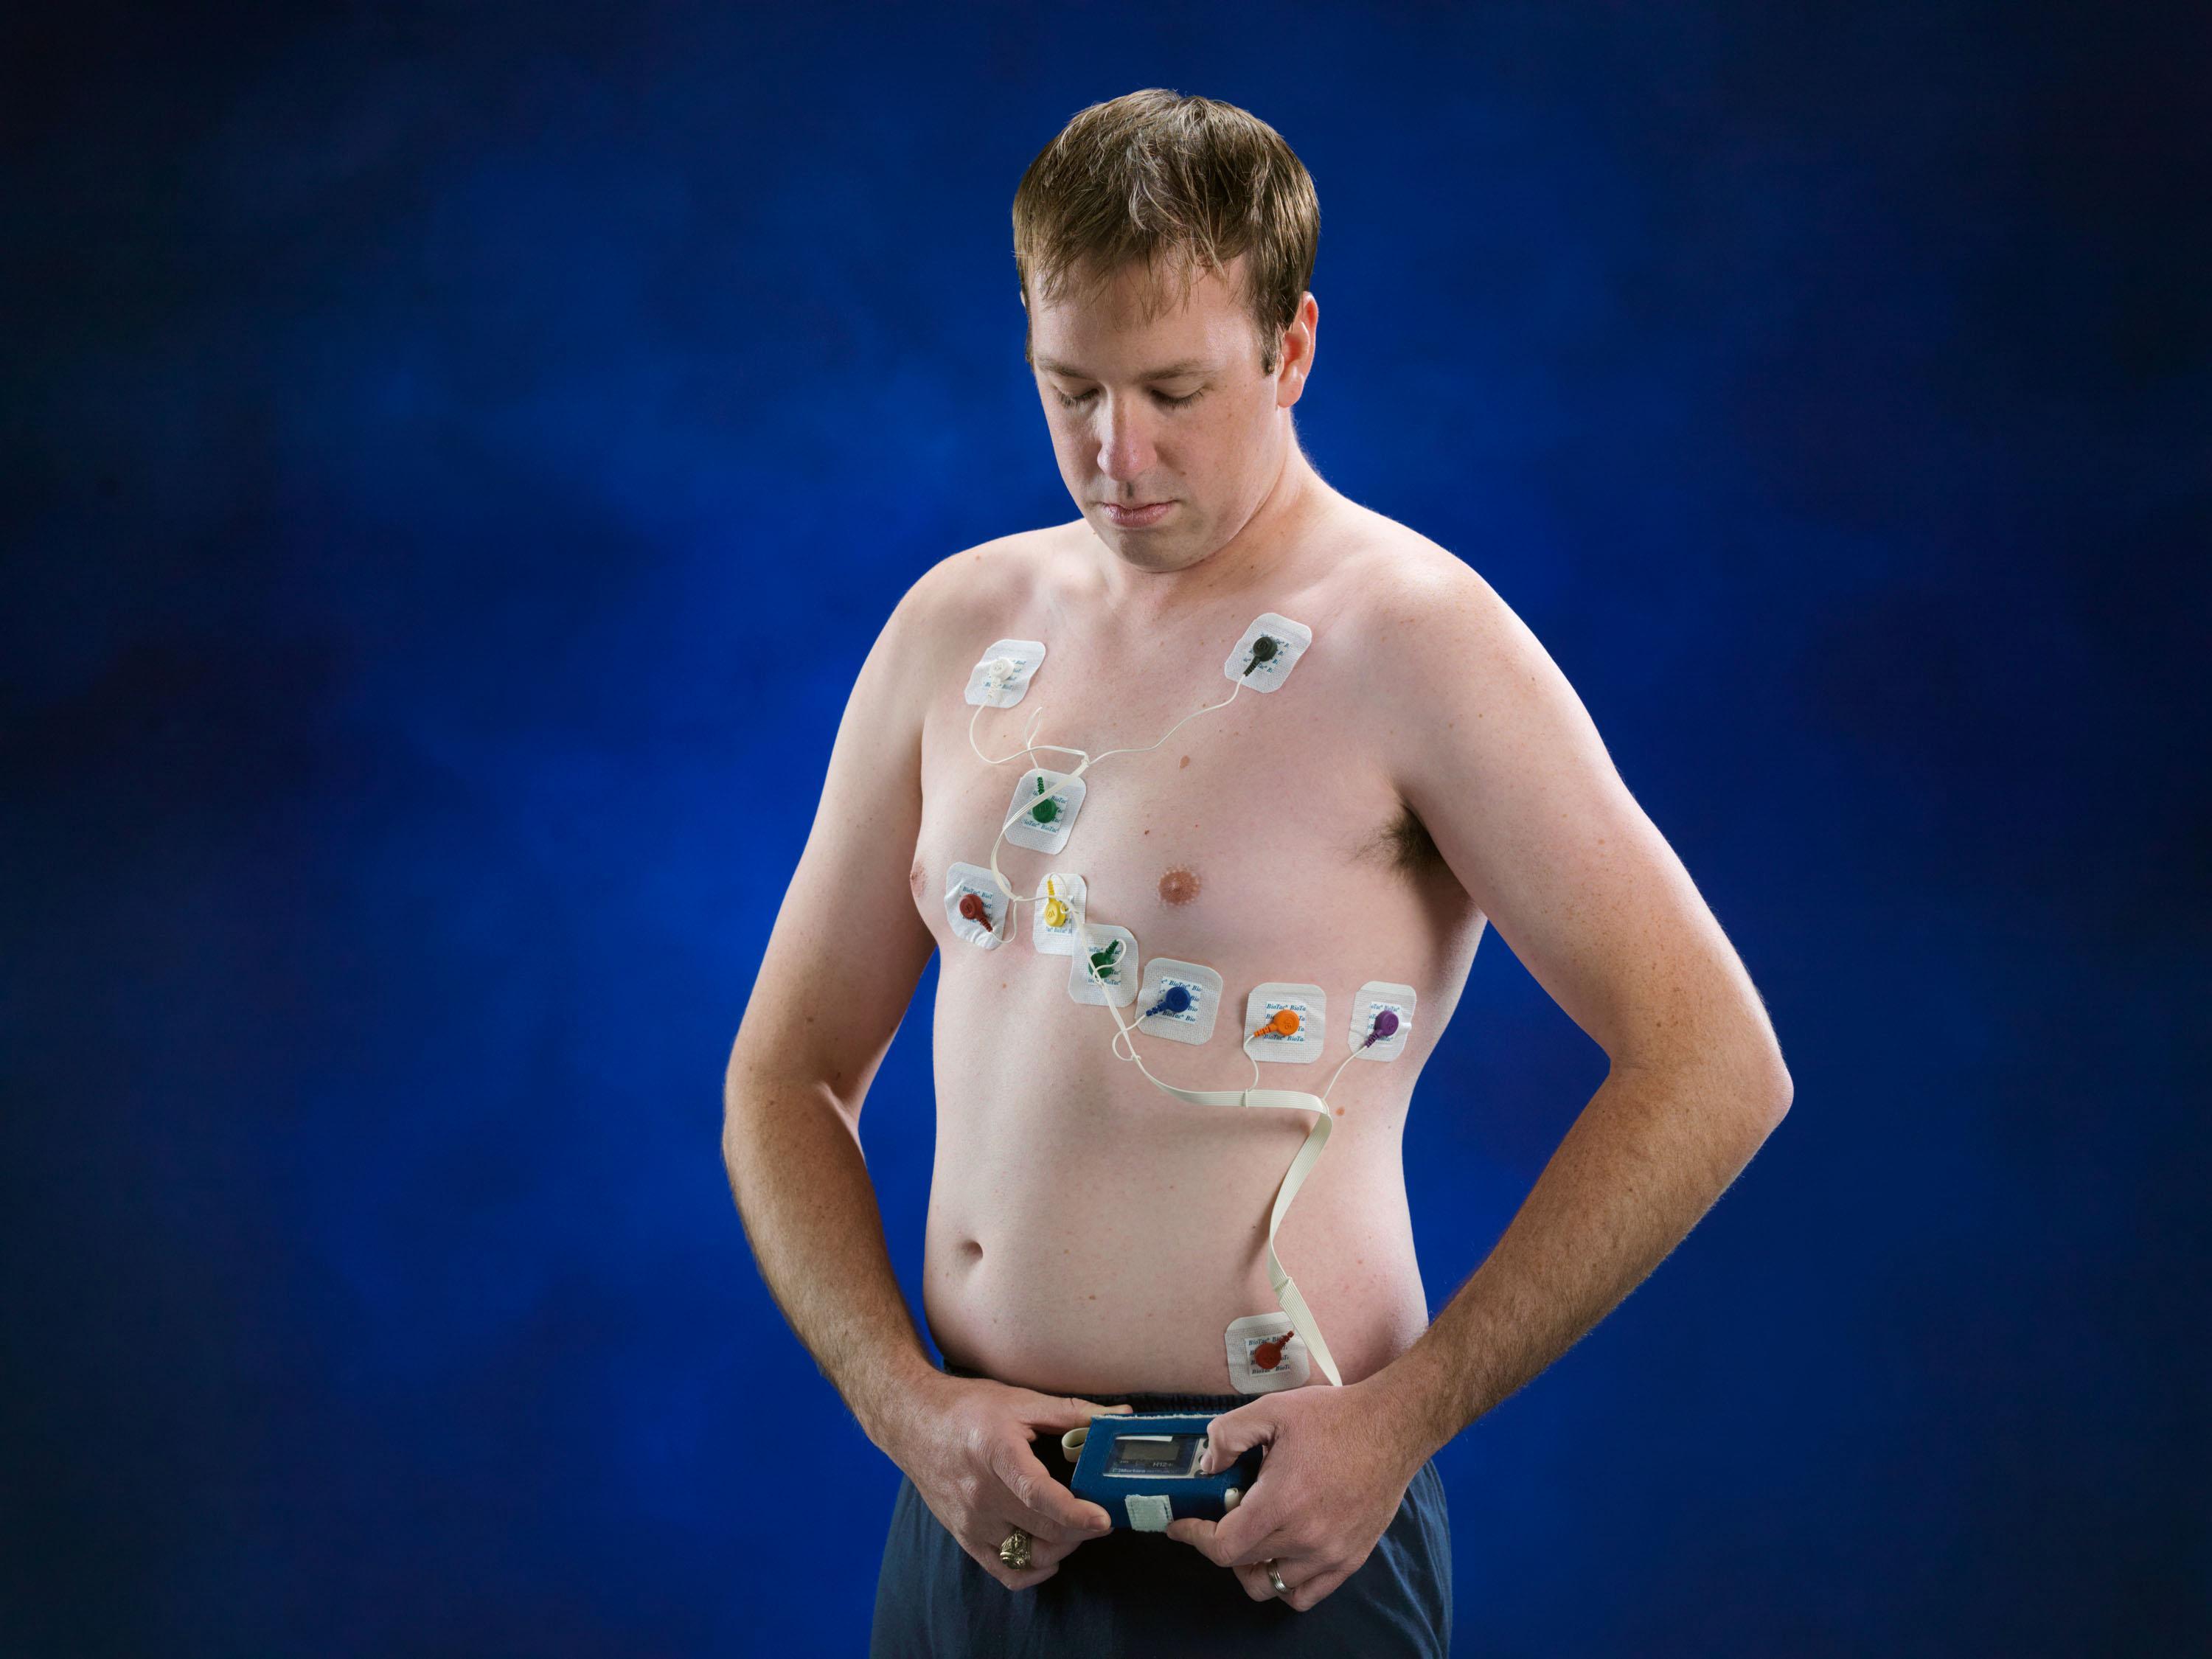
ECG Electrodes:
These are the white, adhesive patches placed at specific points on the patient’s chest to detect electrical impulses. They contain a conductive gel that reduces skin impedance, allowing the sensor to accurately pick up the millivolt-level signals generated by the heart’s depolarization.
Lead Wires:
The color-coded cables connecting the electrodes to the recording unit are known as lead wires. They act as the transmission pathway, carrying the electrical signals from the skin surface to the digital recorder for storage and processing.
Digital Recorder:
The blue device held at the waist is the Holter recorder, a battery-operated unit that functions as the central processing hub. It digitizes and stores the continuous stream of cardiac data on a flash memory card, allowing for retrospective analysis by a cardiologist after the monitoring period is complete.
The Role of Continuous Ambulatory Monitoring
Standard cardiac testing usually begins with a resting 12-lead ECG, which records the heart’s activity for approximately ten seconds. While this is excellent for identifying permanent structural damage or constant rhythm abnormalities, it often fails to catch transient issues. Many heart rhythm problems are paroxysmal, meaning they occur unpredictably and may last only a few seconds or minutes. The Holter monitor solves this problem by providing ambulatory electrocardiography, essentially carrying the diagnostic lab with the patient as they sleep, work, and exercise.
The setup displayed in the image features a multi-lead configuration, which offers a detailed view of the heart’s electrical vectors. While a basic Holter might use fewer leads, the 10-lead setup shown allows for a more comprehensive analysis, similar to a standard 12-lead ECG but over a longer duration. This is particularly useful for detecting not just rhythm disturbances, but also transient changes in blood flow to the heart muscle.
During the monitoring period, patients are typically asked to keep a detailed diary of their activities and symptoms. If a patient feels dizzy or experiences a racing heart at a specific time, they note it in the diary. The cardiologist can then cross-reference this timestamp with the recorded heart rhythm to see if a specific electrical abnormality correlates with the patient’s symptoms.
- Common indications for wearing a Holter monitor include:
- Evaluation of unexplained palpitations or fluttering sensations in the chest.
- Investigation of unexplained syncope (fainting) or pre-syncope (lightheadedness).
- Monitoring the efficacy of anti-arrhythmic medications or pacemaker function.
- Detection of “silent” ischemia, where the heart lacks oxygen without causing chest pain.
Clinical Focus: Cardiac Arrhythmia
The primary disease state investigated using a Holter monitor is arrhythmia, which refers to any disorder of the heart rate or rhythm. In a healthy heart, the electrical signal originates in the sinoatrial (SA) node, causing the atria to contract, followed by the ventricles. This produces a regular, rhythmic beat typically between 60 and 100 beats per minute. When this electrical pathway malfunctions, the heart may beat too fast (tachycardia), too slow (bradycardia), or irregularly.
One of the most significant conditions diagnosed via Holter monitoring is Atrial Fibrillation (AFib). In AFib, the upper chambers of the heart quiver chaotically rather than contracting effectively. This can lead to blood pooling in the atria, increasing the risk of clot formation and stroke. Because AFib can be paroxysmal (coming and going), a patient might have a normal heartbeat during a doctor’s appointment but go into fibrillation hours later. The Holter monitor captures these episodes, allowing for timely intervention with anticoagulants or rate-control medications.
Another critical application is the detection of myocardial ischemia. While arrhythmias are electrical issues, ischemia is a plumbing issue—a lack of blood flow to the heart muscle due to coronary artery disease. Ischemia often changes the shape of the electrical wave (specifically the ST segment) on the ECG. A high-fidelity Holter monitor can track these ST-segment changes during physical exertion or stress, alerting the physician to potential blockages in the coronary arteries even if the patient does not report classic chest pain (angina).
Conclusion
The Holter monitor remains a gold standard in the non-invasive diagnosis of cardiovascular disorders. By bridging the gap between a patient’s subjective symptoms and objective physiological data, it allows clinicians to make accurate diagnoses that a standard ECG cannot provide. whether investigating a benign skipped beat or a life-threatening rhythm disorder, the data gathered by this compact device is essential for guiding effective treatment plans and ensuring long-term cardiac health.

