Explore the critical relationship between the partial pressure of oxygen (PO2) and hemoglobin saturation, as illustrated by the oxygen-hemoglobin dissociation curve. This article elucidates how this curve dictates oxygen loading in the lungs and efficient unloading to tissues, a cornerstone of respiratory physiology and clinical assessment.
Understanding Oxygen Transport: The Hemoglobin-Oxygen Partnership
The efficient transport of oxygen from the lungs to every cell in the body is a cornerstone of human physiology. This vital process is primarily facilitated by hemoglobin, a protein found within red blood cells, which has a remarkable ability to bind reversibly with oxygen. The relationship between the partial pressure of oxygen (PO2) in the blood and the percentage of hemoglobin binding sites occupied by oxygen—known as hemoglobin saturation—is graphically represented by the oxygen-hemoglobin dissociation curve.
This curve is not a simple linear relationship; rather, it is sigmoid (S-shaped), reflecting the cooperative binding nature of hemoglobin. Understanding this curve is paramount in medical practice, as it explains how the body optimizes oxygen uptake in the oxygen-rich environment of the lungs and effectively releases oxygen in the oxygen-depleted environment of the tissues. Any shift or alteration in this curve can have significant clinical implications for oxygen delivery and overall patient health.
Key aspects of this relationship include:
- Efficient oxygen loading in the lungs.
- Effective oxygen unloading to tissues.
- Sensitivity to changes in PO2 at tissue level.
These principles are critical for maintaining cellular function and overall physiological balance.
The Oxygen-Hemoglobin Dissociation Curve Explained
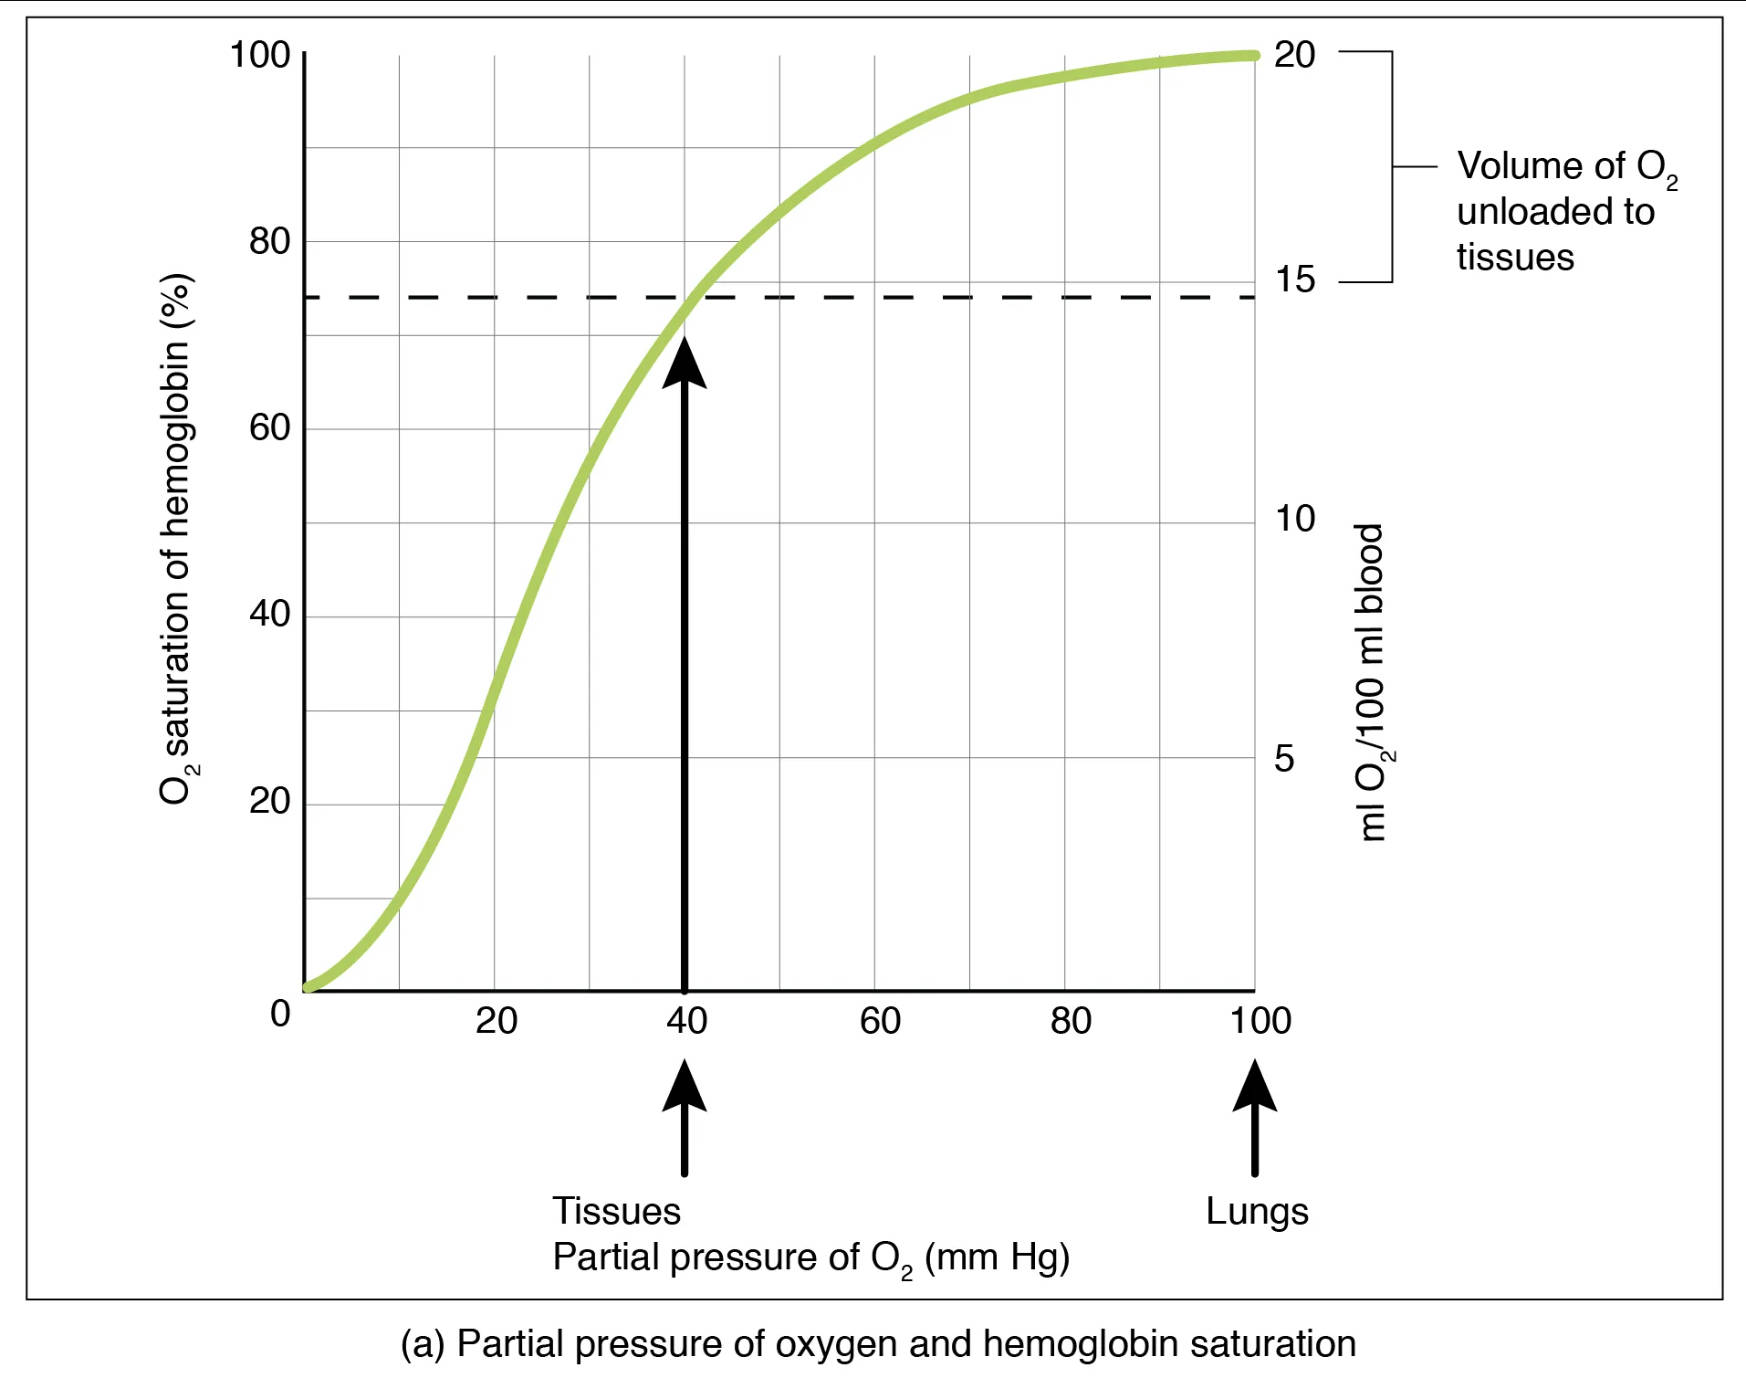
The oxygen-hemoglobin dissociation curve illustrates the affinity of hemoglobin for oxygen at various partial pressures. The y-axis typically represents the percentage of hemoglobin saturation with oxygen, while the x-axis represents the partial pressure of oxygen (PO2) in millimeters of mercury (mm Hg).
O2 saturation of hemoglobin (%): This vertical axis indicates the percentage of hemoglobin molecules that are currently bound to oxygen. A higher percentage means more oxygen is being carried by the blood.
Partial pressure of O2 (mm Hg): This horizontal axis represents the partial pressure of oxygen, which is the driving force for oxygen to bind to or dissociate from hemoglobin. Higher partial pressures, such as those in the lungs, promote oxygen loading.
Lungs: At the partial pressure of oxygen typically found in the lungs (around 100 mm Hg), hemoglobin is almost fully saturated with oxygen, usually between 95-98%. This high saturation ensures maximum oxygen uptake from the inhaled air.
Tissues: At the partial pressure of oxygen typically found in active tissues (around 40 mm Hg), hemoglobin saturation drops significantly to about 75%. This lower saturation indicates that oxygen has been released to the cells where it is needed for metabolic processes.
Volume of O2 unloaded to tissues (ml O2/100 ml blood): This scale on the right y-axis quantifies the amount of oxygen released from the blood to the tissues. It highlights the efficiency of oxygen delivery, showing that approximately 5 ml of O2 is unloaded per 100 ml of blood during normal activity.
Interpreting the Curve: Loading and Unloading Oxygen
The sigmoid shape of the curve is crucial for its physiological function. In the steep portion of the curve, from a PO2 of about 10 to 60 mm Hg, even small drops in PO2 lead to significant amounts of oxygen being unloaded from hemoglobin. This is particularly advantageous at the tissue level, where cells are actively consuming oxygen, thus lowering the local PO2. For instance, at a tissue PO2 of 40 mm Hg, hemoglobin is still about 75% saturated, but it has already released a considerable amount of oxygen (around 5 ml O2 per 100 ml of blood) for cellular use.
Conversely, the flat upper portion of the curve, corresponding to PO2 values typically found in the lungs (around 70-100 mm Hg), demonstrates a remarkable safety margin. Even if the alveolar PO2 decreases somewhat (e.g., due to mild lung disease or moderate altitude), hemoglobin remains highly saturated, ensuring efficient oxygen loading. This “plateau effect” is a testament to the robust design of our respiratory system, ensuring that blood is nearly saturated with oxygen before being pumped to the rest of the body.
Factors Affecting Oxygen-Hemoglobin Affinity
The oxygen-hemoglobin dissociation curve is not static; it can shift to the left or right, indicating changes in hemoglobin’s affinity for oxygen. A rightward shift means hemoglobin has a reduced affinity for oxygen, releasing more oxygen to the tissues for a given PO2. Factors that cause a rightward shift include:
- Increased CO2 (Bohr Effect): Higher partial pressure of carbon dioxide, common in metabolically active tissues, makes the blood more acidic, promoting oxygen release.
- Decreased pH (Increased Acidity): Similar to CO2, increased acidity (lower pH) weakens the oxygen-hemoglobin bond.
- Increased Temperature: Active muscles generate heat, which also promotes oxygen dissociation from hemoglobin.
- Increased 2,3-Bisphosphoglycerate (BPG): This molecule, produced by red blood cells, binds to hemoglobin and reduces its affinity for oxygen, particularly during chronic hypoxia or anemia.
Conversely, a leftward shift indicates an increased affinity of hemoglobin for oxygen, meaning less oxygen is released to the tissues. This can occur with decreased CO2, increased pH, decreased temperature, or decreased BPG. Clinically, understanding these shifts is vital for managing conditions that affect oxygen delivery, such as anemia, carbon monoxide poisoning, or respiratory distress syndrome. For example, in carbon monoxide poisoning, carbon monoxide binds to hemoglobin with much higher affinity than oxygen, causing a dramatic leftward shift and preventing oxygen release to tissues, leading to hypoxia.
Conclusion
The oxygen-hemoglobin dissociation curve is a cornerstone concept in respiratory physiology, brilliantly illustrating the dynamic relationship between oxygen partial pressure and hemoglobin saturation. Its sigmoid shape and sensitivity to various physiological factors ensure optimal oxygen loading in the lungs and efficient unloading to metabolically active tissues. A profound understanding of this curve and its shifts is indispensable for healthcare professionals in diagnosing and managing a wide range of conditions affecting oxygen transport and delivery, ultimately playing a critical role in maintaining cellular viability and overall patient well-being.

