Mendelian Inheritance Explained: Understanding Random Segregation and Punnett Squares
This diagram illustrates the fundamental principles of Mendelian inheritance, specifically focusing on the concept of random segregation and how alleles combine through successive generations. Utilizing Punnett squares, this visual guide tracks the inheritance patterns of a single gene with two alleles, demonstrating how dominant and recessive traits manifest and reappear. This foundational understanding is crucial for comprehending genetic transmission in various biological contexts.
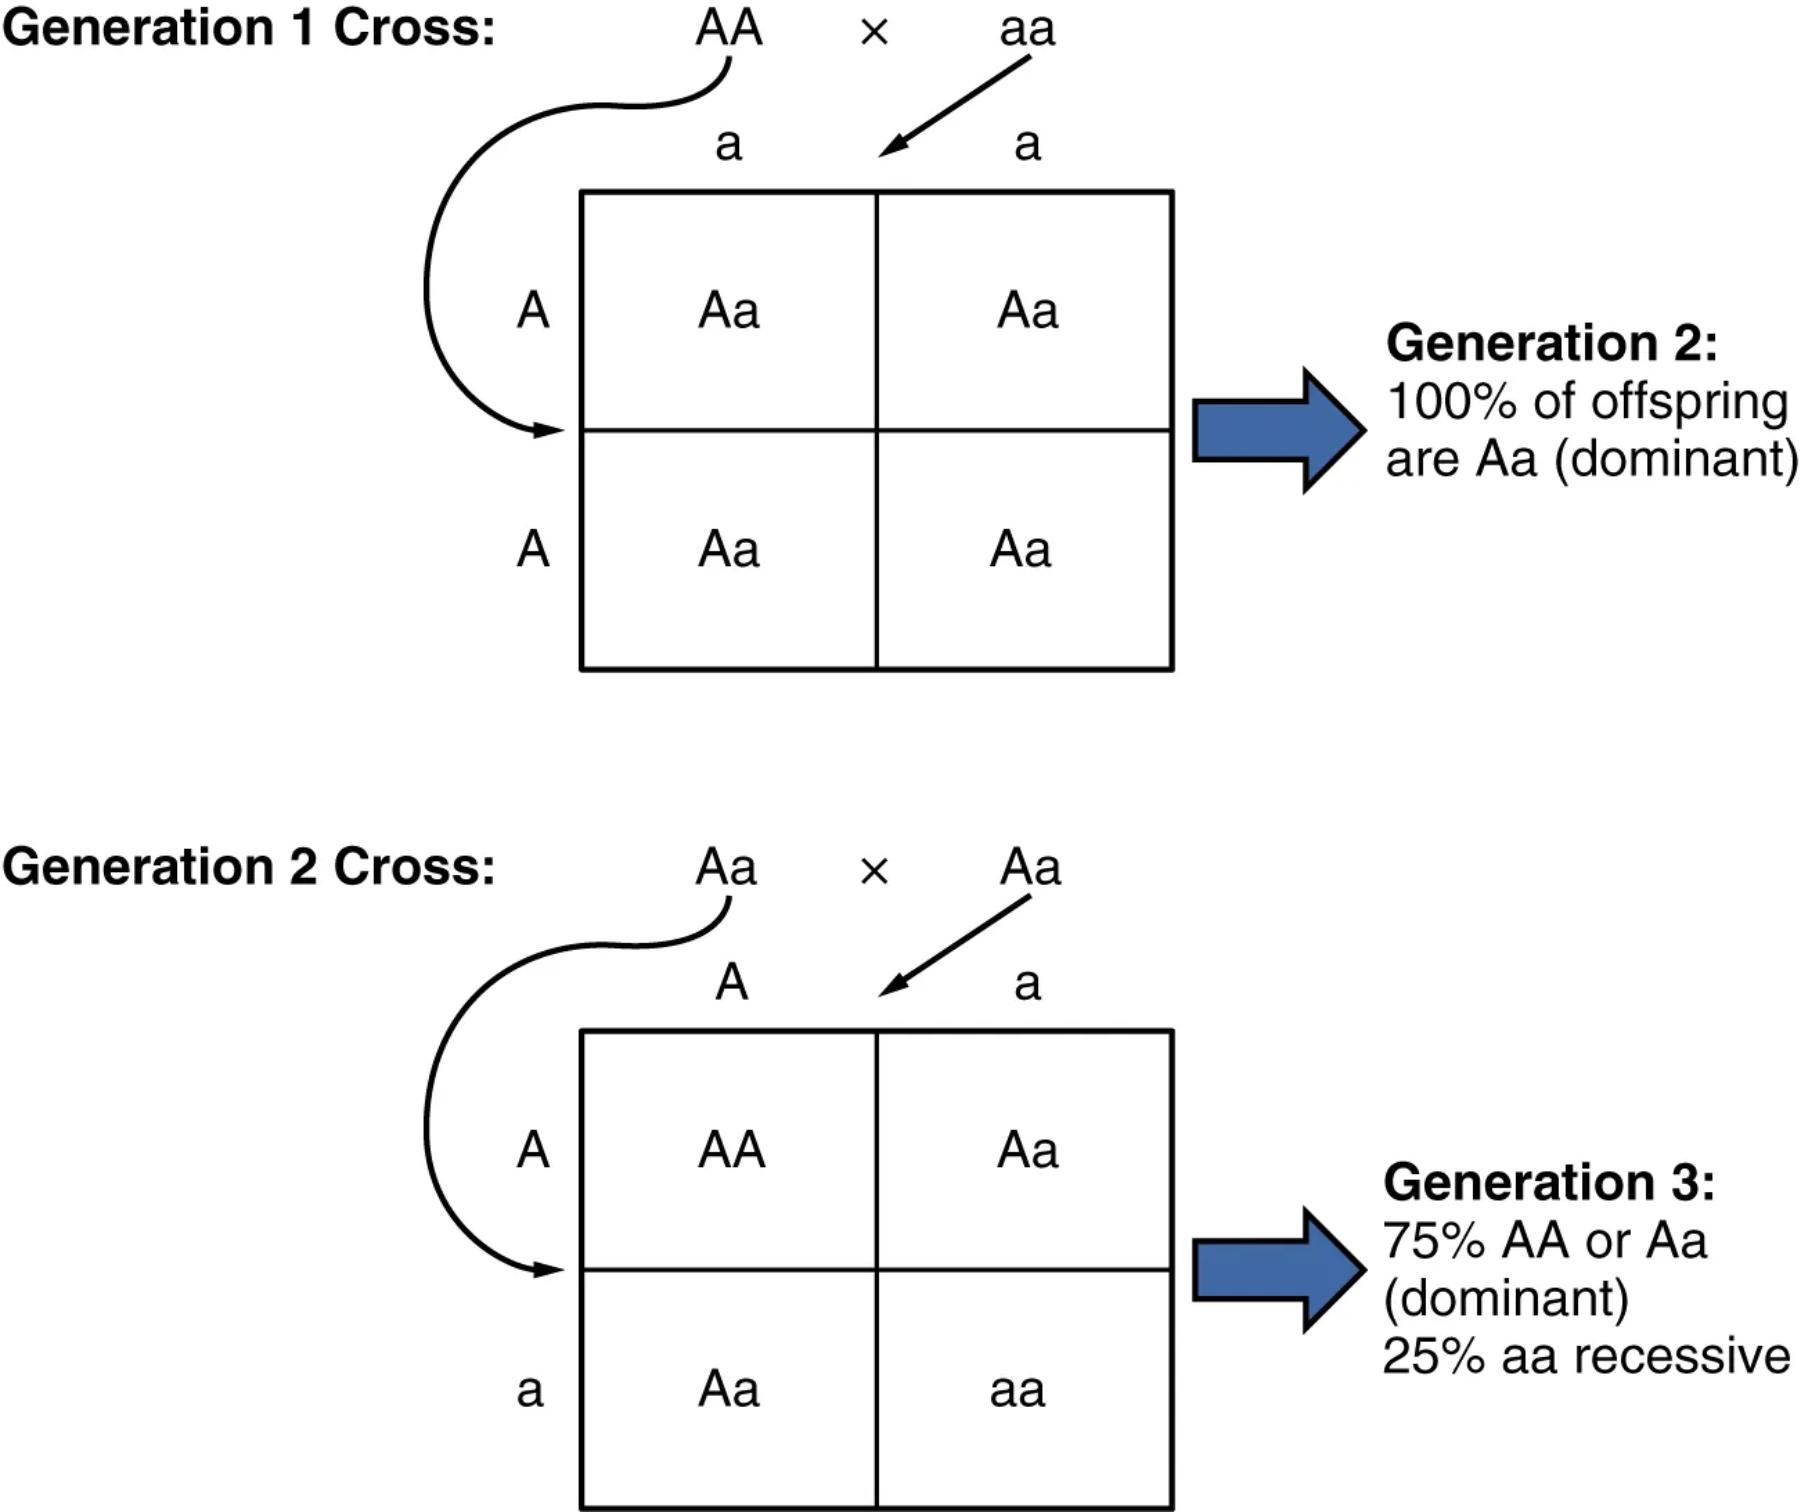
Generation 1 Cross: AA x aa: This represents the initial cross between two parental organisms. One parent is homozygous dominant (AA), meaning it carries two identical dominant alleles. The other parent is homozygous recessive (aa), carrying two identical recessive alleles. This cross sets the stage for observing the first filial generation’s genotype and phenotype.
Punnett Square (Generation 1): This 2×2 grid is a graphical tool used to predict the genotypes of offspring from a genetic cross. The alleles from one parent (A, A) are placed along the top, and the alleles from the other parent (a, a) are placed along the side. Each box within the square represents a possible genotype for the offspring.
Offspring Genotype (Aa): The boxes in the first Punnett square all show Aa, indicating that 100% of the offspring from the Generation 1 Cross are heterozygous. This means each offspring receives one dominant allele (A) from the homozygous dominant parent and one recessive allele (a) from the homozygous recessive parent.
Generation 2: 100% of offspring are Aa (dominant): This label confirms that all offspring from the first cross are heterozygous (Aa) and will express the dominant phenotype, as the dominant allele (A) masks the expression of the recessive allele (a).
Generation 2 Cross: Aa x Aa: This represents the cross between two individuals from the first filial generation, both of whom are heterozygous (Aa). This intercross is critical for observing the reappearance of the recessive phenotype in the subsequent generation.
Punnett Square (Generation 2): Similar to the first, this Punnett square tracks the potential allele combinations when two heterozygous parents (Aa) are crossed. The alleles A and a from one parent are placed on top, and A and a from the other parent are placed on the side.
Offspring Genotypes (AA, Aa, aa): The boxes in the second Punnett square show three possible genotypes: AA, Aa, and aa. This distribution demonstrates the random segregation of alleles during gamete formation.
Generation 3: 75% AA or Aa (dominant), 25% aa recessive: This summarizes the phenotypic and genotypic ratios expected in the third generation. There is a 75% chance that offspring will express the dominant phenotype (genotypes AA or Aa), and a 25% chance that offspring will express the recessive phenotype (genotype aa), which was masked in Generation 2.
The image provided offers a clear visual elucidation of Gregor Mendel’s groundbreaking principles of inheritance, specifically the law of random segregation. This fundamental concept in genetics dictates that during the formation of gametes (sperm and egg cells), the two alleles for a heritable character segregate (separate) from each other so that each gamete carries only one allele for that character. When fertilization occurs, the offspring inherits one allele from each parent, creating a new combination. This diagram meticulously tracks these combinations across two generations, beginning with a cross between parents of contrasting homozygous genotypes.
The initial cross, labeled “Generation 1 Cross: AA x aa,” demonstrates how a homozygous dominant parent (AA) passes on only ‘A’ alleles, and a homozygous recessive parent (aa) passes on only ‘a’ alleles. Consequently, all offspring in the first filial (F1) generation are heterozygous (Aa). Phenotypically, these F1 individuals will all express the dominant trait, as the ‘A’ allele masks the expression of the ‘a’ allele. This observation directly supports Mendel’s law of dominance, where one allele’s presence completely conceals the effect of the other.
The power of Mendelian genetics becomes even more evident in the “Generation 2 Cross: Aa x Aa.” Here, two heterozygous F1 individuals are mated. Due to random segregation, each parent can produce gametes containing either the ‘A’ allele or the ‘a’ allele with equal probability. The resulting Punnett square clearly illustrates the possible genotypic combinations in the F2 generation:
- 25% will be homozygous dominant (AA)
- 50% will be heterozygous (Aa)
- 25% will be homozygous recessive (aa)
This distribution leads to the classic Mendelian phenotypic ratio of 3:1 for dominant to recessive traits in the F2 generation, meaning 75% of offspring will display the dominant phenotype (AA or Aa) and 25% will display the recessive phenotype (aa). This reappearance of the recessive phenotype, previously masked in the F1 generation, is a cornerstone observation supporting the particulate nature of inheritance, where genetic factors (alleles) remain discrete entities even when unexpressed.
The principles of random segregation and independent assortment, first elucidated by Gregor Mendel, are cornerstones of modern genetics. This diagram beautifully encapsulates the predictable patterns of inheritance for a single gene with two alleles. The initial cross between homozygous dominant (AA) and homozygous recessive (aa) parents invariably yields a first filial (F1) generation that is 100% heterozygous (Aa). This uniformity in the F1 generation is a direct consequence of each parent contributing only one type of allele to their offspring. Phenotypically, all F1 individuals will express the dominant trait, demonstrating the concept of complete dominance.
The real insight into genetic transmission comes from the second cross, where two F1 heterozygotes (Aa x Aa) are mated. This cross is pivotal because it allows for the re-expression of the recessive trait. The Punnett square for this generation vividly illustrates how the alleles (A and a) from each parent segregate randomly into gametes, leading to various combinations in the offspring. The resulting genotypic ratio of 1 AA : 2 Aa : 1 aa is a hallmark of monohybrid crosses. This genotypic distribution translates into a phenotypic ratio of 3 dominant : 1 recessive, meaning there is a 25% chance for the recessive phenotype to reappear. This predictability is fundamental to genetic counseling, breeding programs, and understanding the inheritance of many traits and diseases.
Understanding these foundational genetic principles is essential for various fields, from agriculture, where it informs selective breeding for desirable traits, to medicine, where it helps predict the inheritance patterns of genetic disorders. For example, many single-gene disorders, such as cystic fibrosis (recessive) or Huntington’s disease (dominant), follow these Mendelian patterns. Predicting the probability of an offspring inheriting a specific genetic condition relies heavily on accurately applying the principles of random segregation and using tools like the Punnett square. This diagram, therefore, is not just an academic exercise but a practical guide to the basic mechanisms that govern heredity in all sexually reproducing organisms. It underscores the mathematical predictability inherent in biological processes.

