The systemic blood pressure diagram offers a detailed visualization of how blood pressure varies across the circulatory system, from the aorta to the venae cavae. This chart is an essential tool for grasping the dynamics of cardiovascular function, illustrating the pressure gradients that sustain life and support organ perfusion effectively.
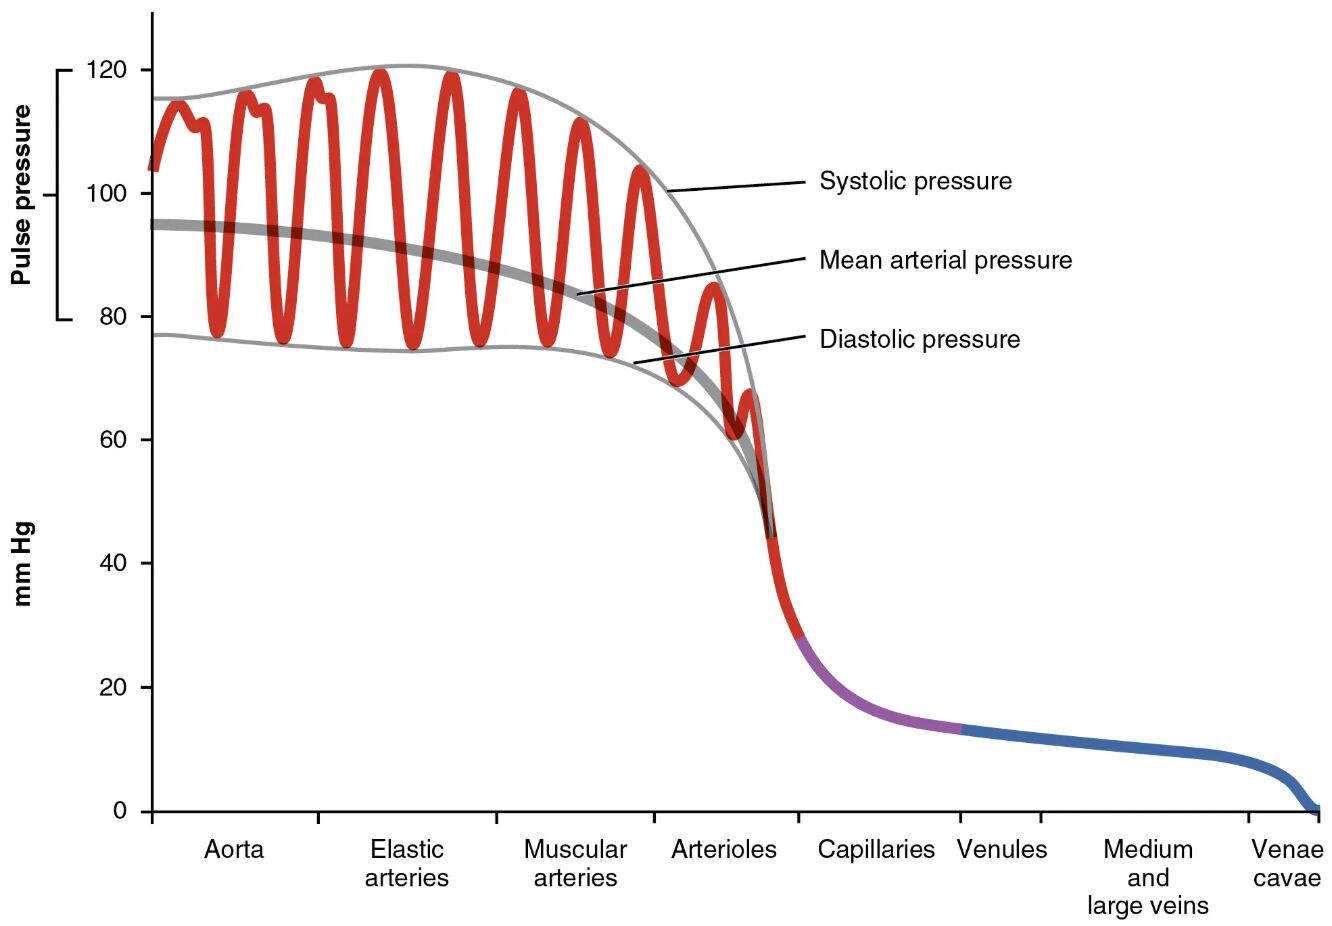
Systolic pressure Systolic pressure represents the peak pressure in the arteries during ventricular contraction, typically ranging from 100 to 120 mmHg. This measurement reflects the heart’s force in pumping oxygenated blood into the systemic circulation.
Mean arterial pressure Mean arterial pressure is the average pressure in the arteries over a cardiac cycle, approximating 70-100 mmHg depending on health status. It is a critical indicator used to assess tissue perfusion and overall cardiovascular health.
Diastolic pressure Diastolic pressure indicates the lowest pressure in the arteries during ventricular relaxation, usually around 60-80 mmHg. This value reflects the resistance in the vascular system and the heart’s resting phase.
Aorta The aorta, as the largest artery, experiences the highest systolic pressure, often exceeding 120 mmHg. Its elastic walls absorb this pressure, smoothing the pulsatile flow from the heart.
Elastic arteries Elastic arteries, such as the carotid and subclavian arteries, maintain high pressure with values around 100-120 mmHg. Their elasticity helps dampen the pressure wave, ensuring steady blood flow to downstream vessels.
Muscular arteries Muscular arteries, like the brachial and femoral arteries, carry pressure around 90-110 mmHg. These vessels regulate flow to specific organs through muscular walls that can constrict or dilate.
Arterioles Arterioles, the smallest arteries, reduce pressure to approximately 40-60 mmHg. They control blood entry into capillaries through vasoconstriction, playing a key role in blood pressure regulation.
Capillaries Capillaries exhibit the lowest pressure, around 20-40 mmHg, due to their thin walls and vast network. This low pressure facilitates the exchange of oxygen, nutrients, and waste with tissues.
Venules Venules collect blood from capillaries with pressures dropping to 10-20 mmHg. They transition blood from the high-exchange capillaries to the venous system, aiding return flow.
Medium and large veins Medium and large veins, including the jugular and iliac veins, maintain pressure around 5-10 mmHg. Their thin walls and large lumens allow them to act as capacitance vessels, storing significant blood volume.
Venae cavae The venae cavae, the largest veins returning blood to the heart, have pressures near 0-5 mmHg. This low pressure reflects their role in facilitating venous return with minimal resistance.
Overview of Systemic Blood Pressure
The diagram provides a clear depiction of pressure changes from the heart’s ejection to venous return. Understanding these variations is fundamental to assessing cardiovascular efficiency.
- Pressure starts high in the aorta due to ventricular systole, gradually declining as blood moves through the arterial system.
- Elastic arteries and muscular arteries help maintain pressure, ensuring consistent delivery to organs.
- Arterioles act as gatekeepers, reducing pressure to protect delicate capillaries.
- The drop to near-zero in venae cavae supports the heart’s suction effect during diastole.
The Role of Pressure Types
Each pressure type offers unique insights into cardiac and vascular function. These measurements guide clinical evaluations and therapeutic decisions.
- Systolic pressure peaks with each heartbeat, influenced by stroke volume and arterial stiffness.
- Mean arterial pressure reflects the average force driving perfusion, calculated as diastolic pressure plus one-third of pulse pressure.
- Diastolic pressure indicates vascular tone and coronary perfusion during the heart’s rest phase.
- Pulse pressure, the difference between systolic and diastolic, highlights arterial compliance.
Arterial Pressure Dynamics
Arterial segments show a progressive pressure decline, reflecting their structural adaptations. This gradient ensures efficient blood distribution.
- The aorta withstands peak pressures, with elastic recoil aiding continuous flow.
- Elastic arteries absorb energy, reducing pressure to around 100 mmHg by the time it reaches muscular arteries.
- Muscular arteries further distribute blood, adjusting flow based on metabolic demand.
- Arterioles fine-tune pressure, dropping it to levels safe for capillary exchange.
Capillary and Venous Pressure
The transition to capillaries and veins marks a shift to lower pressure environments. This change supports exchange and return functions.
- Capillaries maintain a pressure of 20-40 mmHg, optimal for filtration and diffusion per Starling’s principle.
- Venules collect blood at reduced pressure, transitioning to the venous system’s low-resistance pathways.
- Medium and large veins hold blood at 5-10 mmHg, aided by skeletal muscle pumps and valves.
- Venae cavae near 0-5 mmHg ensure smooth entry into the right atrium, driven by thoracic pressure changes.
Clinical Relevance of Blood Pressure Distribution
Understanding this pressure gradient aids in diagnosing and managing cardiovascular conditions. It provides a baseline for interpreting abnormalities.
- Elevated systolic pressure may indicate hypertension, stressing arterial walls over time.
- Low diastolic pressure can signal vasodilation or heart failure, affecting coronary flow.
- Mean arterial pressure below 60 mmHg may compromise organ perfusion, requiring intervention.
- Variations in capillary pressure can lead to edema if hydrostatic forces overwhelm oncotic pressure.
In conclusion, the systemic blood pressure diagram is a vital educational resource, illustrating how pressure decreases from the aorta to the venae cavae. This knowledge enhances the ability to monitor and support cardiovascular health, offering a window into the body’s remarkable adaptability and resilience. Whether exploring normal physiology or addressing clinical challenges, this chart remains an indispensable guide.

